Most A/B testing statistics online are recycled from the same handful of vendor surveys, quoted without dates, samples or definitions. This page is our attempt at the honest version: what the public numbers actually support, what our own archive of 1640+ tests suggests, and, just as important, which precise cuts we are not publishing because we cannot yet stand behind them.
That last part is deliberate. A benchmarks page you can trust has to tell you where its numbers come from, so every claim below is labelled: public and citable, our published case data, or our qualitative experience. Nothing here is an invented cut dressed as research.
Use it the way you would use any benchmark page: as a calibration against wishful thinking, in either direction. If your numbers look dramatically better than everything below, check the statistics before the champagne. If they look dramatically worse, check the research process before the despair, because the inputs fail far more often than the audiences do.
Most tests do not win, and that is the healthy state
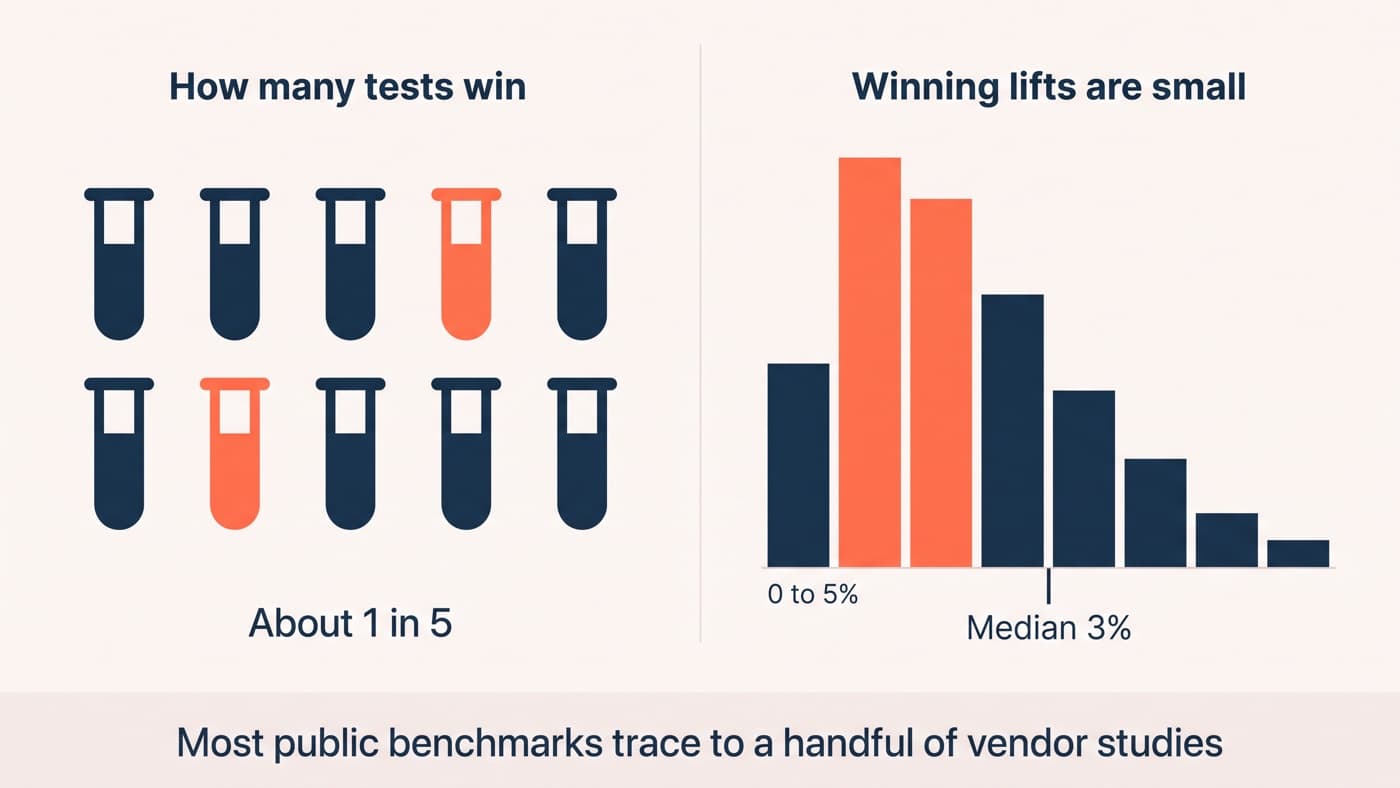
Public analyses from testing platforms and large agencies put the share of tests producing a significant winner somewhere between one in eight and one in three, depending heavily on how win is defined and how disciplined the programme is. Our own working answer, stated on this site for years, is that roughly one test in four or five wins.
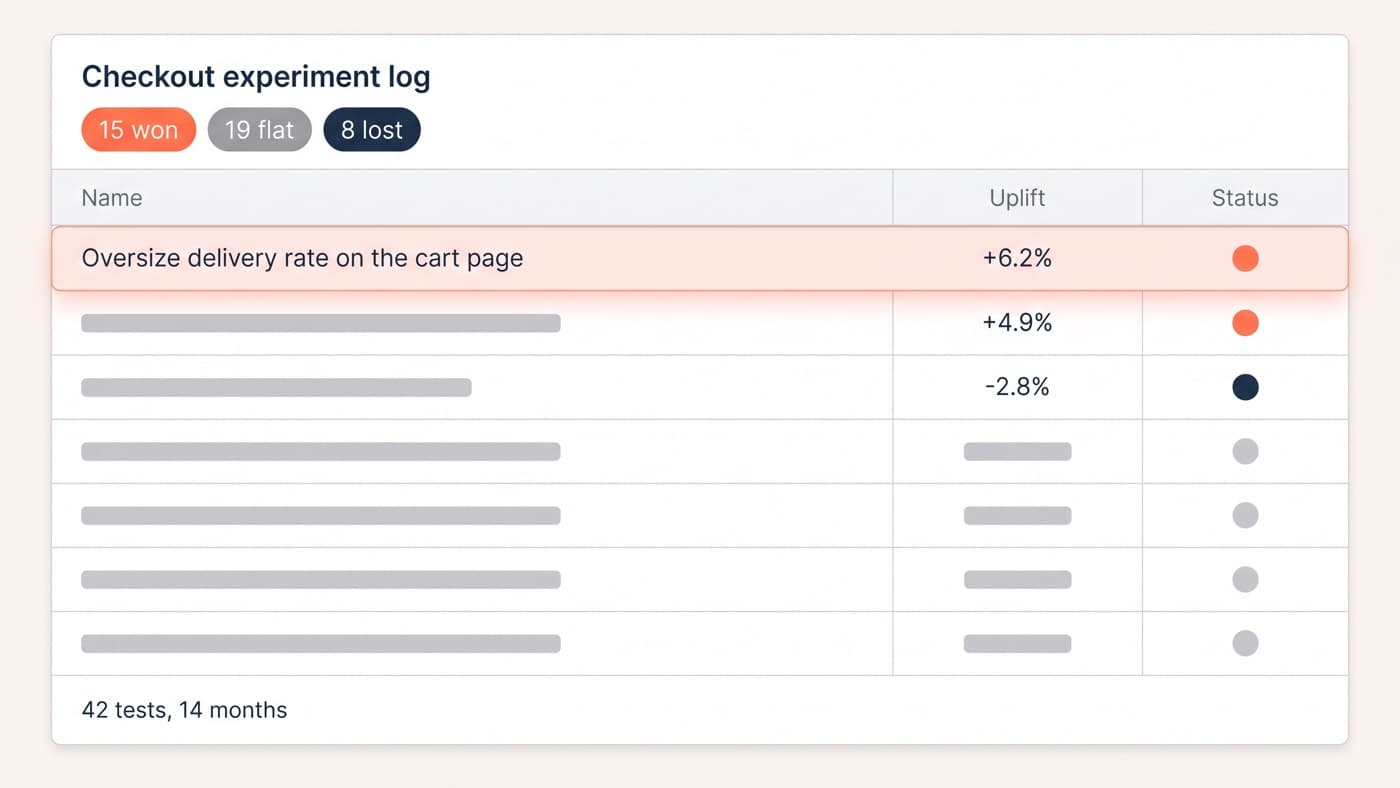
The one fully open dataset we can offer is our published checkout programme: 42 tests, 15 winners, 19 flat, 8 losers, every result including the failures in the write-up. That 36% win rate is above the range we just quoted, and the reason is unexciting: six weeks of research before the first build, and a rule that every hypothesis name the evidence behind it. Win rates are downstream of research discipline, not of testing harder.
Two more things the win-rate conversation usually skips. Flat results are not failures: a well-run test that moves nothing has killed a plausible idea before it consumed a roadmap quarter, and in the checkout programme above, nineteen flat results are why the interface stayed clean. And win rates are not comparable across programmes, because a team that only tests bold, well-researched swings will show a higher rate on fewer tests than a team churning through button colours. When an agency quotes a win rate in a pitch, the number tells you about their test selection at least as much as their skill.
Winning lifts are small, and compound anyway
The distribution of real winning lifts is heavily skewed towards small numbers: most durable winners move their metric by low single digits, and the double-digit lift is the exception that gets the screenshot. In our archive, the pattern repeats: the four biggest winners in that public checkout programme were +6.2%, +4.9%, +3.1% and +2.2%, and together they compounded to about +17.4% completion.
That compounding arithmetic is the single most under-quoted statistic in the field. Four modest winners multiplying together beat any realistic jackpot, and they come with something the jackpot never brings: four documented reasons why, each of which seeds the next test.
The distribution shape matters more than any single average, because programme economics live in the tail. A quarter that produces one 6% winner, two 3% winners and nine flat or losing tests is a normal, healthy quarter, and a finance team calibrated to expect it will fund year two. A finance team promised the vendor-case-study distribution will cancel the programme in month five, right before the compounding starts.
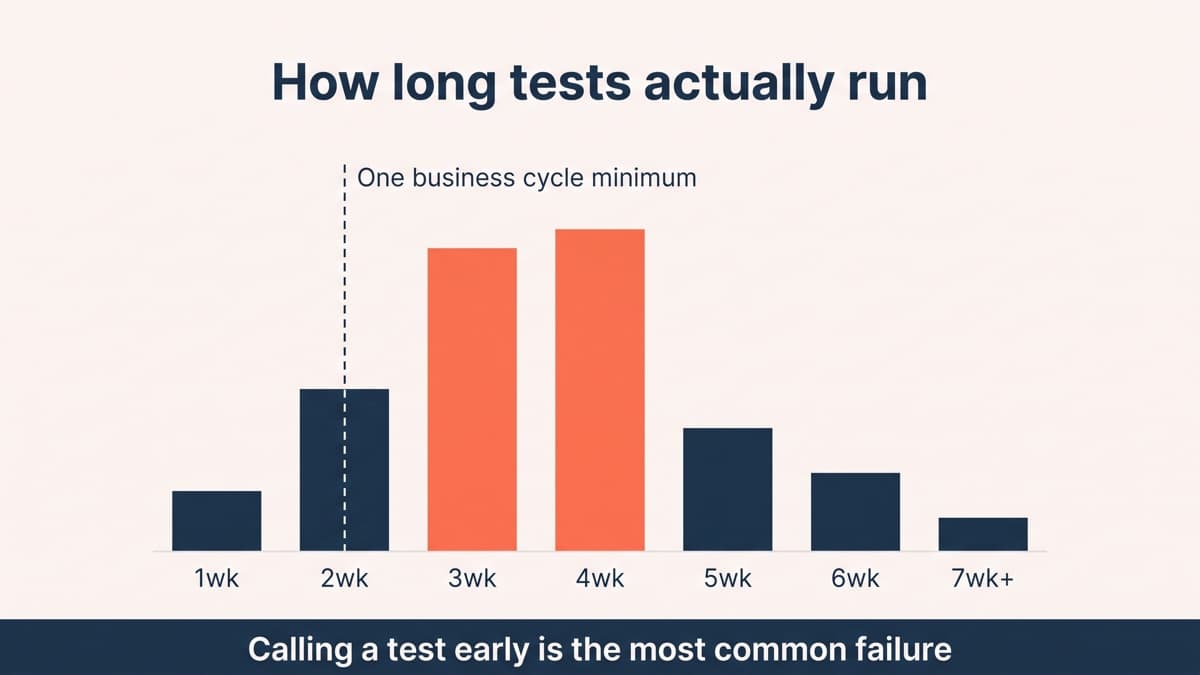
Tests take three to six weeks, whatever the tool promised
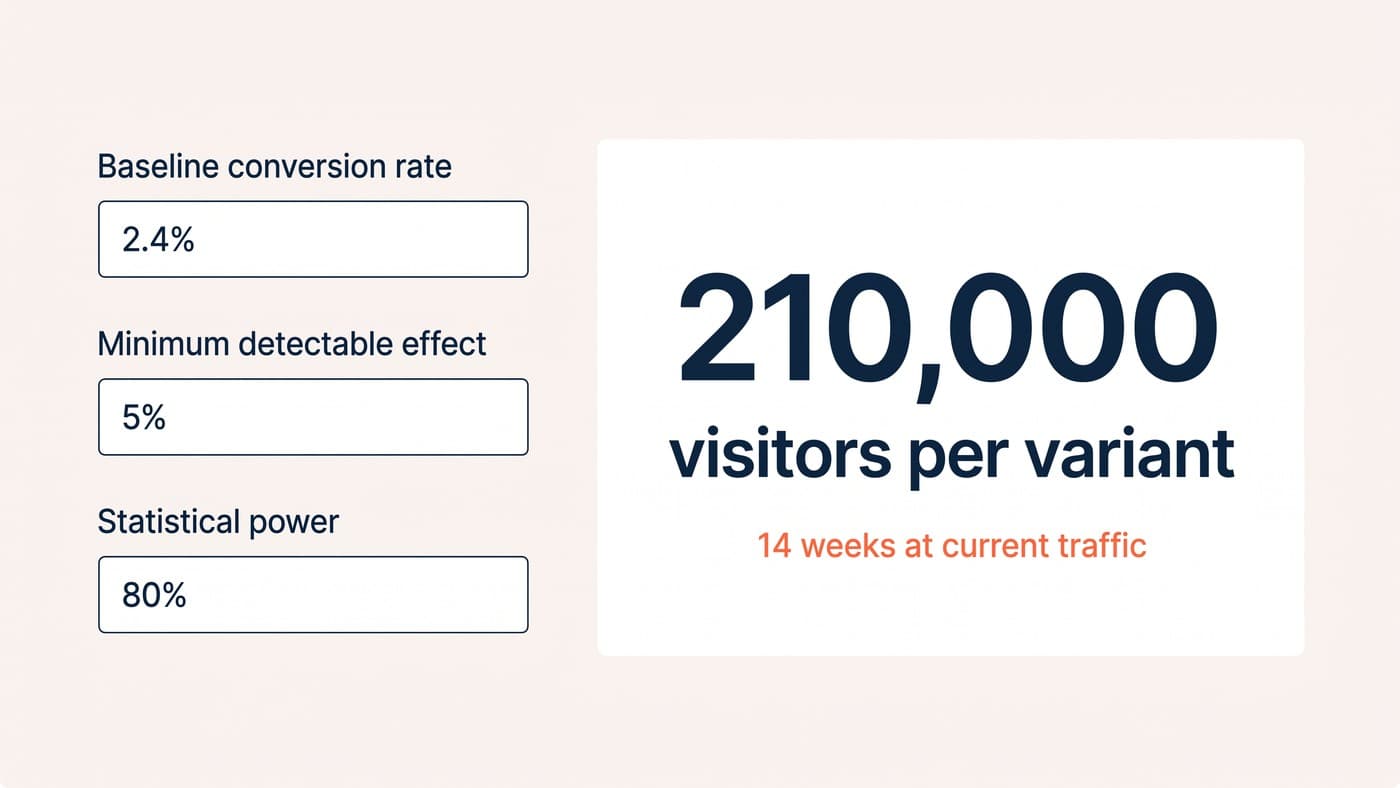
The floor is one full business cycle, because weekday and weekend customers are different people, and payday changes both. The ceiling is set by sample size arithmetic: baseline conversion, minimum detectable effect and traffic decide the duration before launch, and no dashboard optimism shortens it. In our archive the working mode is three to four weeks, with thin funnels like checkout running longer because those tests run one at a time.
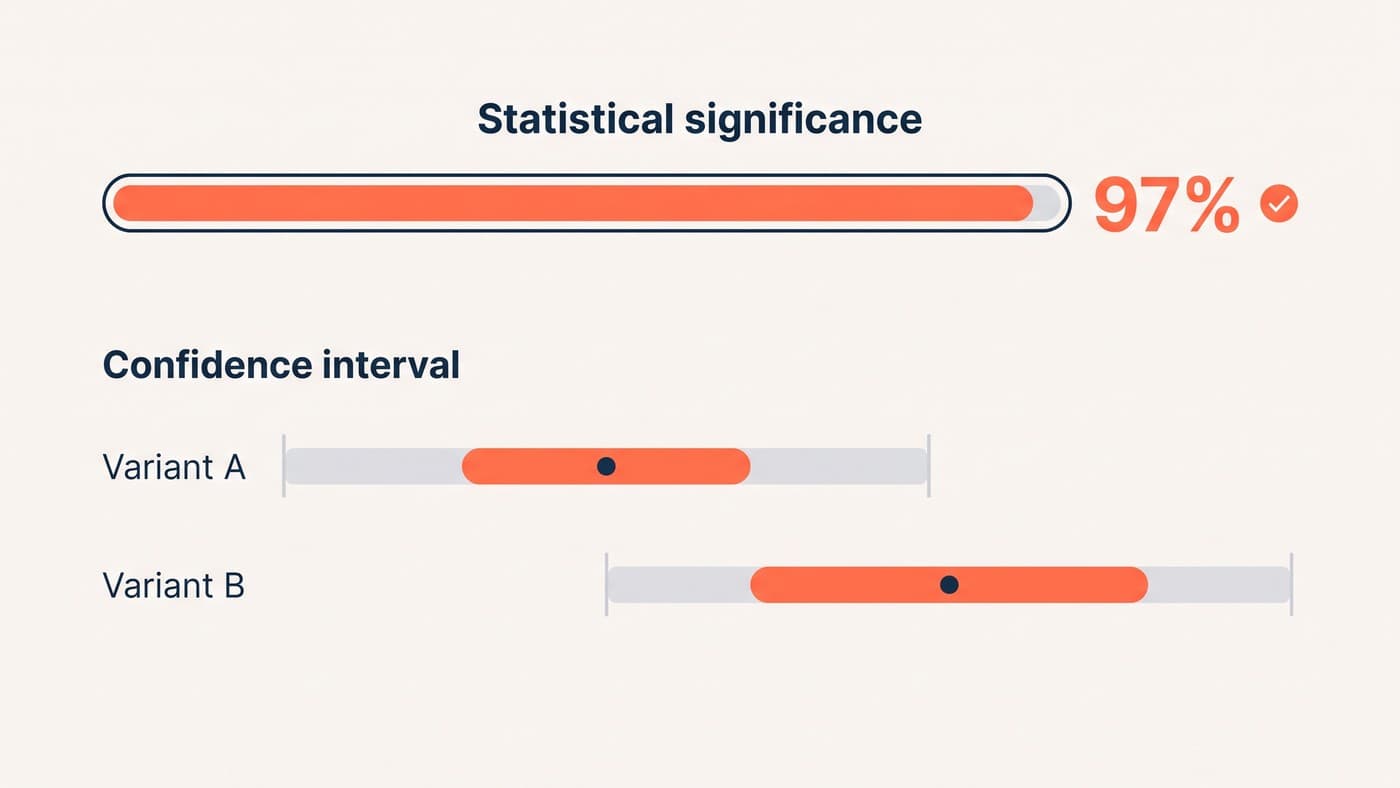
Duration statistics also hide the most expensive behaviour in testing: peeking. A programme that checks daily and stops at the first significant flicker will report impressively short durations and a wonderful win rate, and both numbers are fiction. The mechanics of why are in our guide to statistical significance.
The patterns we will state, qualitatively
Some shapes repeat across the archive consistently enough to be worth stating, as directions rather than decimals. Checkout and cart tests win more often than homepage tests, because they sit where intent is already high and the questions are answerable. Mobile-specific fixes produce larger lifts than their desktop equivalents, mostly because mobile starts further from good. Information changes, what is said and when, outperform aesthetic changes, what it looks like, by enough that we now treat pure restyling hypotheses with suspicion. And the humbling one: redesigns lose to controls often enough that testing before shipping remains the cheapest insurance in ecommerce.
How to use any of this, ours included: benchmarks are for calibrating expectations, never for making decisions. The right use is noticing that your programme reports an 80% win rate and asking what is being miscounted, or seeing fifteen consecutive one-week tests and asking who decided the durations. The wrong use is copying anything, because every number on this page was produced by stores that are not yours.
Four questions strip the varnish off any benchmark you are shown, including these:
- What exactly was counted as a win, and who decided after seeing the data?
- Over what period and sample, and does the source say?
- Who benefits from you believing the number?
- Would the number survive being recalculated by someone with no stake in it?
The numbers we are not publishing yet
Win rate by page type, mobile against desktop win rates, and the share of tests killed for sample ratio mismatch: these are the cuts everyone wants and the ones we decline to publish today, because our archive spans years of different clients, definitions and tools, and a benchmark computed across inconsistent definitions is noise wearing a suit. We are consolidating the archive under one definition of win; when a cut survives that process, it will appear here with its methodology attached.
Until then, treat every precise benchmark you meet, ours included, with the question that deflates most of them: what exactly was counted, over what period, defined by whom? If you want these patterns read against your own store’s numbers rather than the industry’s, get in touch and bring your archive; the reading is more useful in both directions.