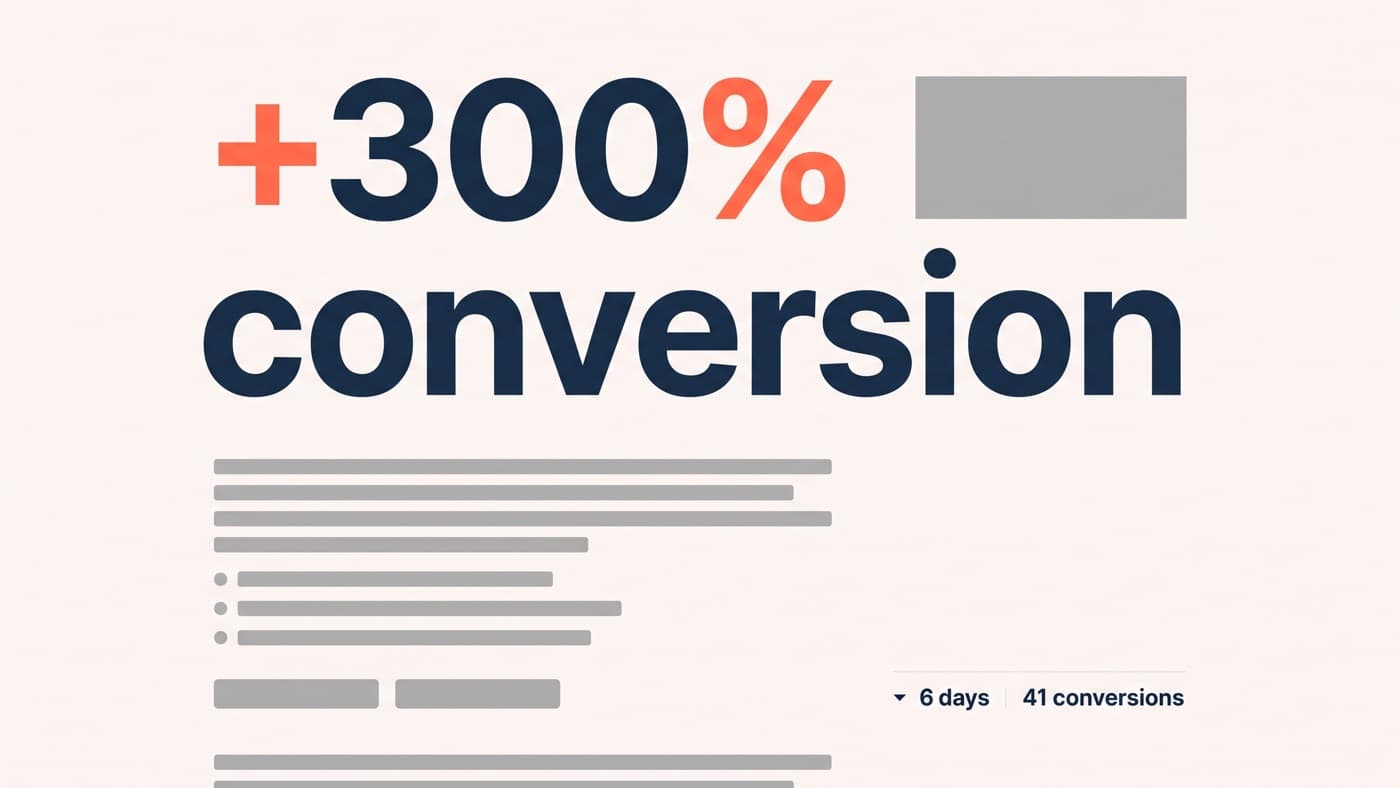
That plus 300% conversion case study you just read probably measured six days and forty-one conversions on a page that was broken to begin with. Reading case studies well is worth roughly as much as running tests, because most conversion decisions inside a business begin with somebody forwarding one and saying we should do this.
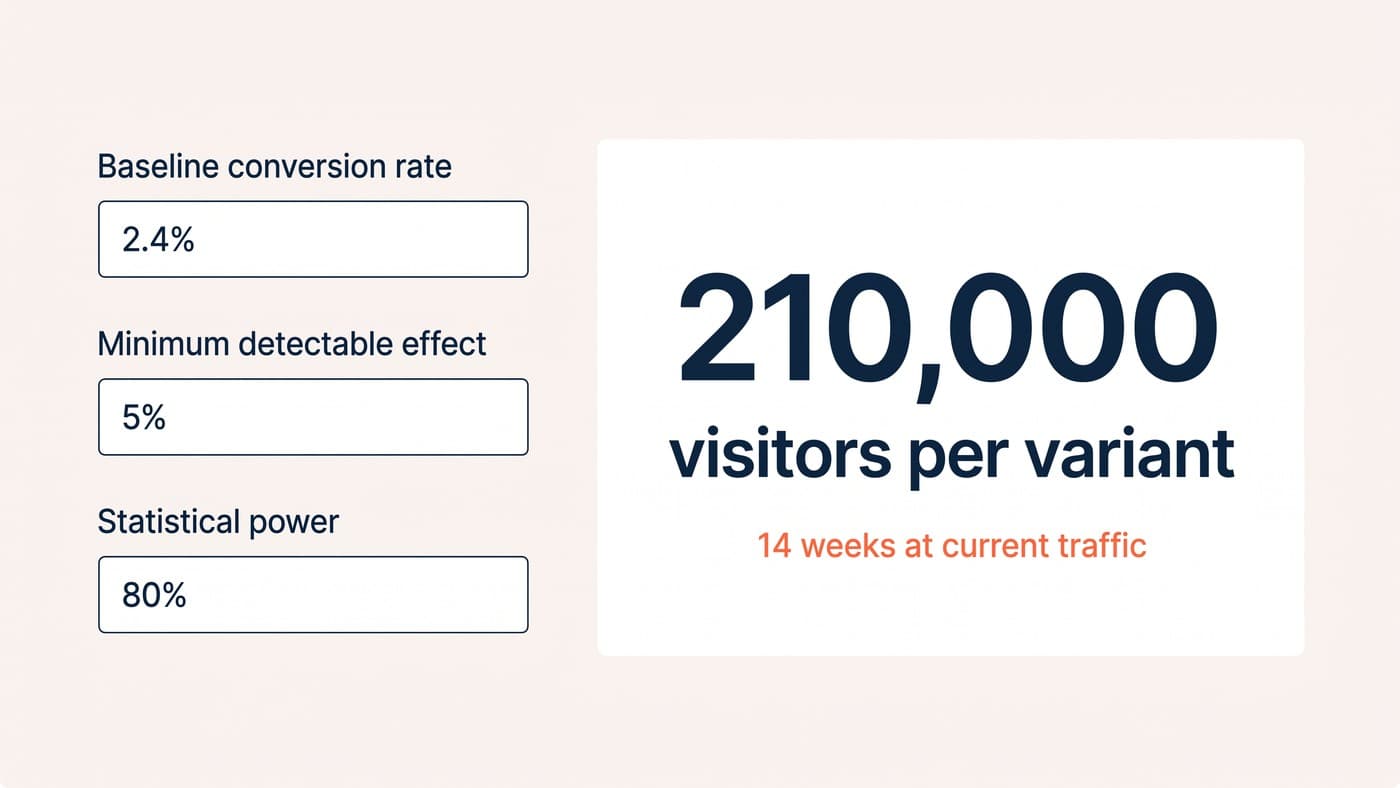
So here are seven questions that expose a weak case study, applied to anybody’s, including ours at the end. How a confidence number is calculated belongs to our guide to statistical significance, and how a sample is worked out before a test starts belongs to the sample size article. You do not need either to use these questions. You need them when an answer looks wrong.
The seven questions
Ask them in order. Most case studies fail on one of the first three, and the ones that survive all seven are rare enough that finding one tells you something about the team as well as about the test.
- What was the baseline? A move from 0.4% to 1.6% is a different animal from 2.4% to 2.8%, and a very low starting point usually means something was broken rather than that something clever was found.
- How large was the sample, counted in conversions rather than visitors? Traffic is the number that gets published; conversions are the number that decides whether the result is readable at all.
- How long did it run? A test that ran six days has not seen a full weekly cycle, and one that ran a single week has seen one of everything, which is not the same as having seen it twice.
- Which metric moved, and does that metric pay? Clicks on a button, add-to-cart rate and email signups are all easier to move than orders, and a write-up reporting the easy metric usually tried the hard one first.
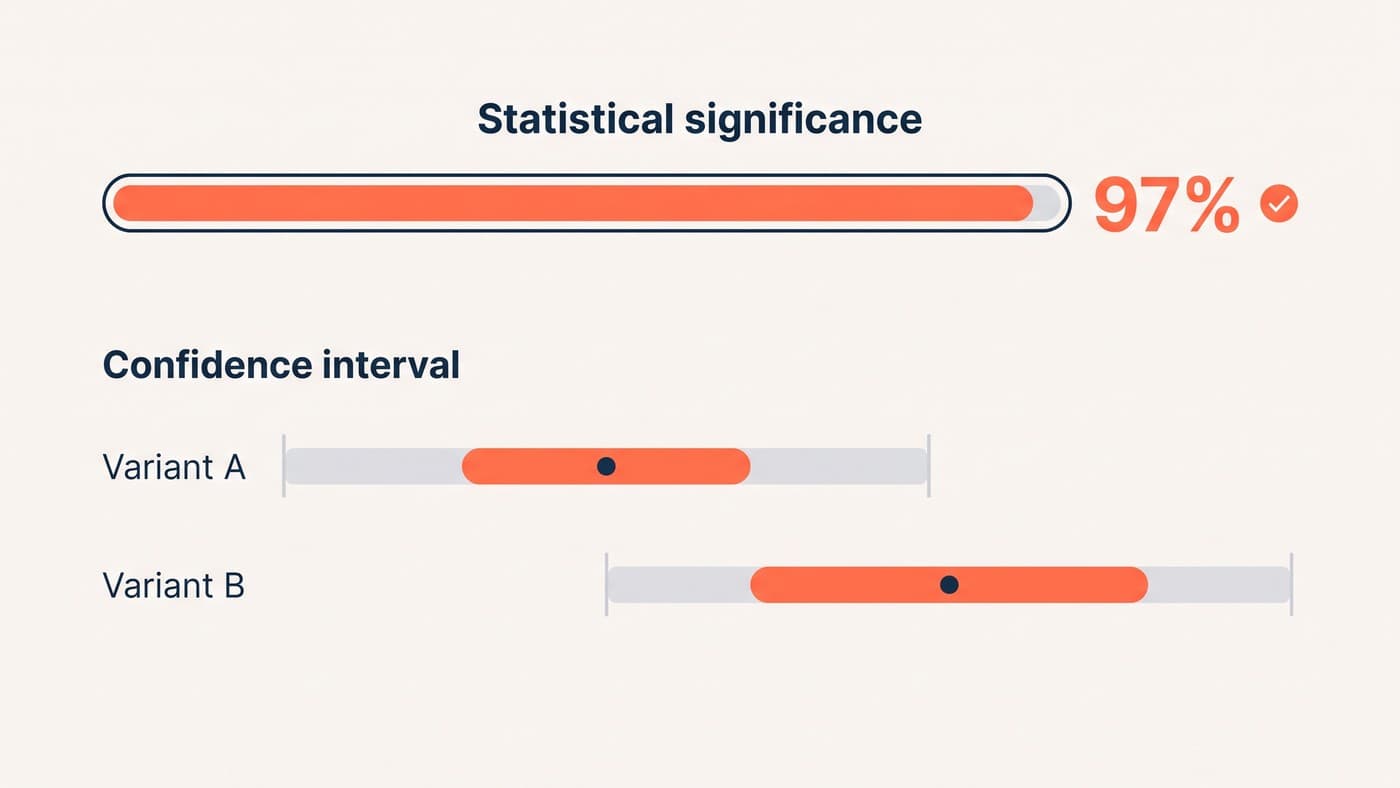
- What confidence, and was the test stopped when it reached it? A result read every morning until it crossed 95% is not a 95% result. If the write-up does not say when the stopping rule was set, assume it was set afterwards.
- Is the headline number a segment? Plus forty per cent among mobile visitors in one country arriving from paid social is a sentence with three filters in it, and each filter is another chance for the number to be noise.
- Did it hold? A winner is a prediction about the future. Ask what the metric did ninety days after rollout, and notice how few case studies contain that paragraph.
The seventh is the one that separates a record from a marketing asset. Everything before it can be answered while the test is still running. Only the last one costs the writer something, because it means going back and rechecking a claim they have already published.
Percentages are where the trick lives
Relative and absolute are both true and only one of them is impressive. A conversion rate moving from 1.2% to 1.6% is a rise of 0.4 percentage points and an increase of 33%, and with traffic and an average order value you can turn the same result into a revenue figure that sounds like either. None of that is dishonest. Choosing which frame to publish is a decision, and a case study that never gives you the baseline has made that decision on your behalf.
The related trick is annualisation. A four-week result multiplied by thirteen becomes a yearly figure, and yearly figures are the ones that end up on slides. It is a projection rather than a measurement, and a case study presenting it as revenue instead of as forecast revenue has quietly changed tense on you.
The portfolio is a survivor
The second problem is not any individual case study. It is the shelf they sit on. Programmes that are working well typically see something like a third of experiments win, a third do nothing and the rest lose, so a portfolio page shows you the top of a distribution whose shape it never mentions. Nothing is being hidden, exactly. You are simply being shown the survivors.
Two questions are worth asking about the shelf rather than about its contents. What was your win rate across every experiment you ran last year, and can I read the write-up of one that lost? A team running a real programme has both answers and is usually pleased to be asked. A team that has only ever won has either a very short history or a very selective archive. The habit that makes the honest answer possible is described in our piece on documenting experiments, where the losses are the entries that earn their keep.
Now run the questions on ours
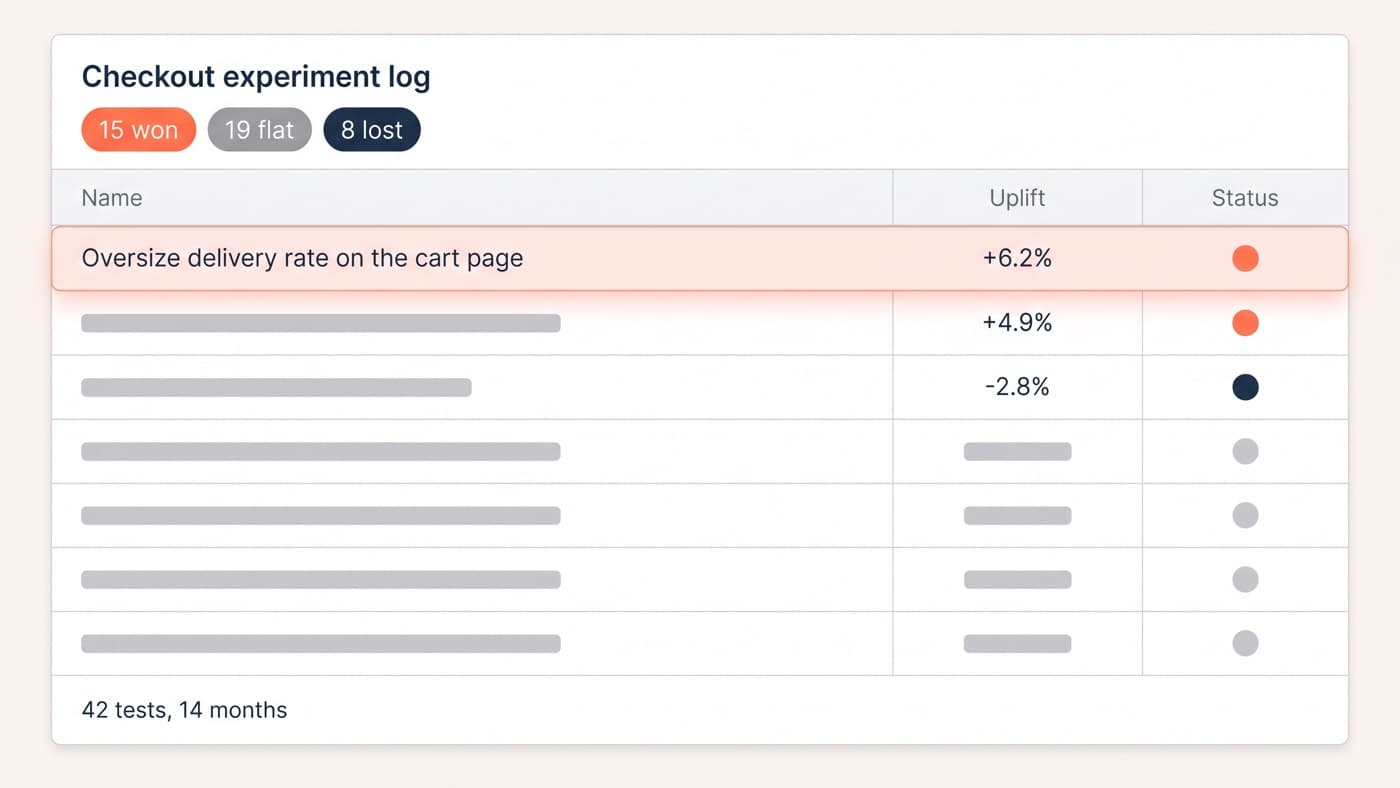
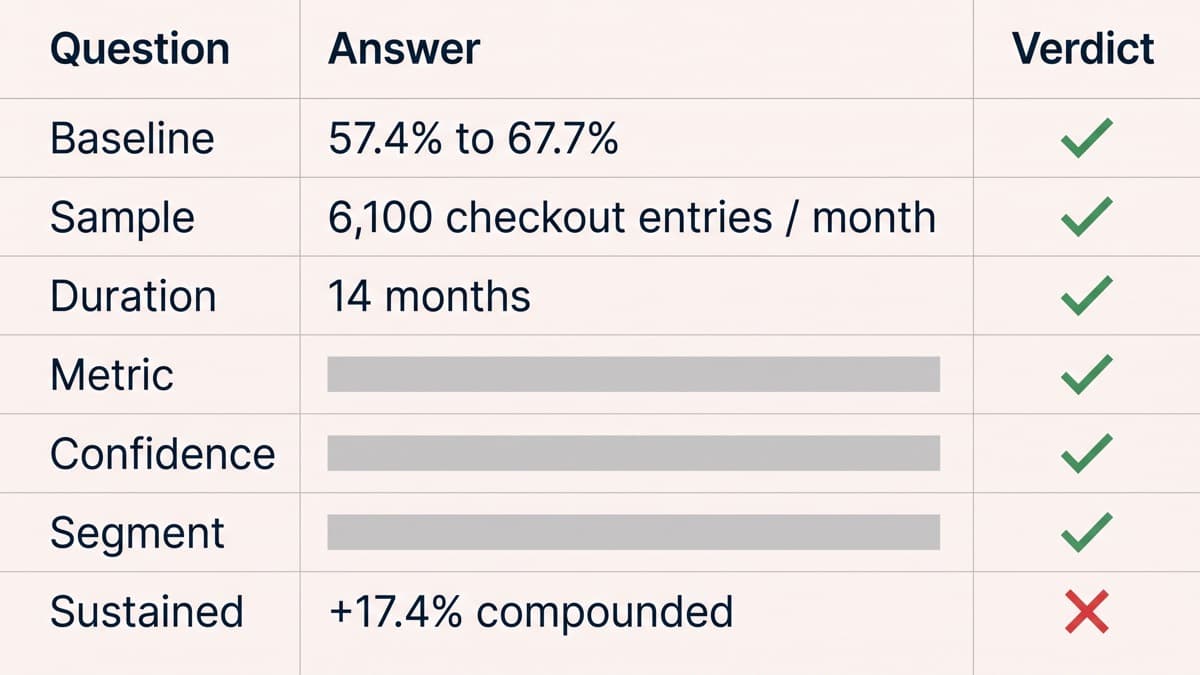
It would be a poor article that armed you with this and then exempted itself, so here is the same test applied to our own. The checkout testing write-up says checkout completion moved from 57.4% to 67.7% across fourteen months and forty-two experiments. Score it.
Baseline is stated and unflattering, which is the easy one. Sample is stated too: roughly 6,100 checkout entries a month, with the write-up admitting that any effect below 4% relative was undetectable in a sensible run time, a constraint most case studies never confess to. Duration is fourteen months, so seasonality is covered rather than assumed away. The metric is checkout completion, which pays, and sitewide conversion is reported beside it, which is the check that stops a checkout win from being a redistribution of the same orders.
Confidence is given per test rather than once for the programme, and the losses and flat results are published: fifteen won, nineteen moved nothing, eight lost. That is the part that makes the rest readable, because a scoreboard carrying all three columns cannot cherry-pick without the gap showing.
Where it is weaker, and you should hold this against it: the compounding figure of roughly plus 17.4% is arithmetic across four winners rather than a single measured before and after, and the annual revenue figure is a projection from a completion rate at a stated average order rather than money counted in a ledger. It is also one client, one sector and one checkout, so none of the individual winners should be expected to transfer to yours. The write-up says as much, but a reader skimming the headline would not know it.
The habit worth building
Keep the seven questions wherever you keep meeting notes and run them the next time somebody forwards a case study with a decision attached to it. The point is not to become the person who dismisses every result. It is that a case study surviving all seven is genuinely useful evidence, while one failing the first three is a screenshot with a percentage on it. If you would like the same interrogation run against a result somebody is currently using to sell you something, send it over and we will say what it does and does not support.