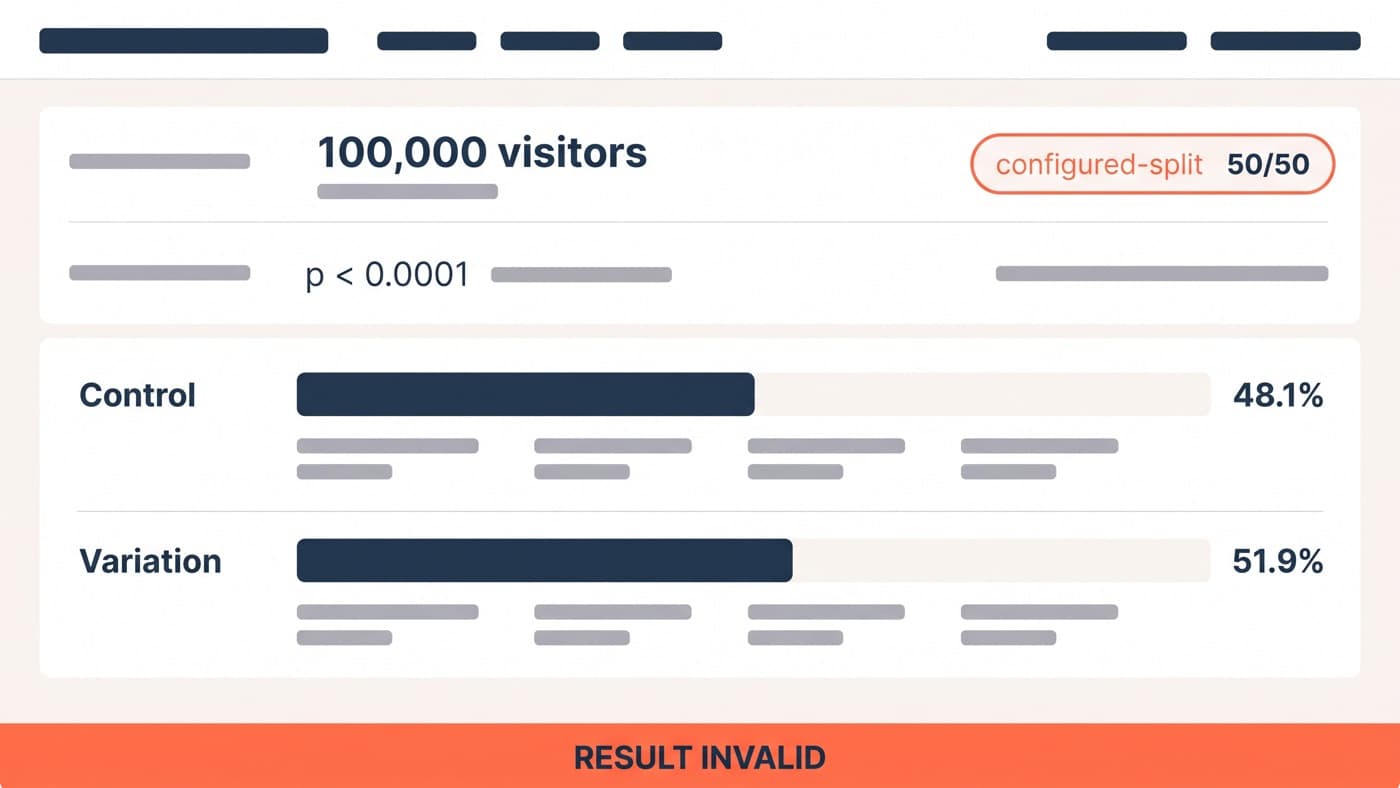
Your dashboard says 48.1% of visitors were shown the control instead of 50%. Close enough? No. Across 100,000 visitors that gap is not rounding, it is a chi-square p-value below 0.0001, and it means the mechanism that was supposed to be assigning people at random was quietly doing something else. Every figure in that report, including the winner you were about to ship, is fiction.
Sample ratio mismatch, SRM for short, gets a single line in our A/B testing glossary, and it earns considerably more than that, because it is the only test failure that voids a result outright instead of weakening it. This post is about the two jobs a definition leaves undone: proving you have one in about two minutes, and finding the cause before anybody reruns anything.
The two-minute check
The check is a chi-square goodness-of-fit test on visitor counts per arm. Not conversions, not sessions after a filter, not whatever your reporting tab shows by default: the raw count of people assigned to each arm, taken as close to the assignment event as your data allows. Feed it the observed counts and the split you configured, read the p-value, and raise the alarm below 0.001. That threshold is deliberately stricter than the 0.05 you use for results, because the cost of investigating a false alarm is an afternoon and the cost of ignoring a real one is a quarter of shipped nonsense.
Scale matters far more than the percentage does, which is where most arguments about SRM go wrong. The 48.1 against 51.9 split above is fatal on 100,000 visitors. The identical percentages on 2,000 visitors give a p-value of roughly 0.09, comfortably inside what chance produces, and calling that an SRM would stop a perfectly healthy test. A ratio is never evidence on its own. Run the number, and run it on day one rather than on the day somebody questions the result, because the fix is cheap while the test is young and expensive once a roadmap has been built on the reading.
Six causes, in the order we find them
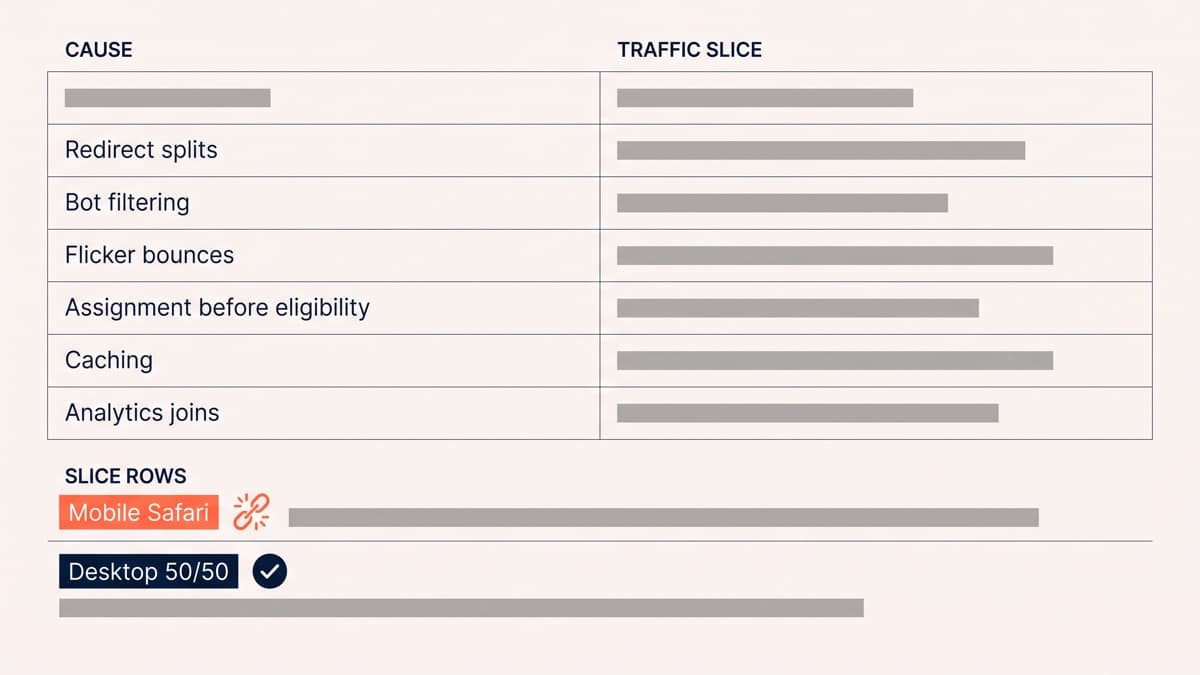
Every SRM is a defect in assignment, or in what happens to a visitor in the first few hundred milliseconds after it. The causes cluster tightly enough that a diagnosis is usually a process of elimination rather than an investigation, and this is the order in which they turn up when we audit a broken test:
- Redirect splits that lose visitors in flight. The variant lives on a second URL, and everyone who abandons during the extra hop is counted as assigned but never counted as arrived.
- Bot and crawler filtering applied unevenly, usually because the filter keys off one arm’s URL pattern, or runs after the variation script rather than before assignment.
- Flicker heavy enough to cost the variant real people. Slow variation rendering makes that arm bounce harder, and a share of those bounces land after bucketing and before the analytics event.
- Assignment firing before eligibility. Visitors are bucketed on page load, an audience condition excludes some of them a moment later, and the exclusion is not symmetrical across arms.
- Caching and CDN behaviour pinning a variant. A cached page or a stale edge response serves one arm to an entire segment of traffic regardless of the split you configured.
- Analytics joins that silently drop sessions. Assignment is correct in the testing tool and wrong in the warehouse, because the visitor identifier changed somewhere between the two systems.
Why the data cannot be salvaged
The instinct is always to rescue the test: trim the larger arm, reweight the smaller one, or segment down to the traffic that still looks clean. All three make matters worse, because an SRM is not a sampling accident. It is proof that assignment was correlated with something about the visitor, and you do not know what. If slow connections dropped out of the variant, the visitors remaining in that arm are systematically faster, more desktop-heavy and further along the intent curve than the control’s. Equalising the row counts does nothing to that difference except conceal it.
This is why SRM belongs in a different category from the ordinary reasons tests fail. A weak hypothesis gives you a true answer to a boring question, which is recoverable. An SRM gives you a confident answer to no question at all, and the more decisive that answer looks, the more likely it is that the bug is doing the deciding. Kill the test, fix the cause, rerun from zero, and resist every suggestion that the number was probably directionally right.
The fix protocol
Work the cause rather than the symptom, in this order. First, locate the break: compare the testing tool’s own bucketing counts against your analytics counts. If the tool is balanced and analytics is not, you have a measurement bug and the experiment itself may be sound. Second, cut the data by device, browser, landing page and traffic source until the ratio breaks in one slice, because an SRM is almost never spread evenly and the slice that carries it usually names the cause outright. Third, fix it and prove the fix with an A/A test on live traffic rather than a smoke test in staging: most of these defects only appear under real load, or under the bot mix a real ad campaign attracts.
Then rerun the original test as a new entry in the archive. Do not resume the old one. The contaminated period cannot be excluded cleanly, because visitors bucketed under the broken assignment carry that assignment forward into the clean period, and a dataset that is half poisoned is harder to argue against than one that is entirely poisoned.
How often this actually happens
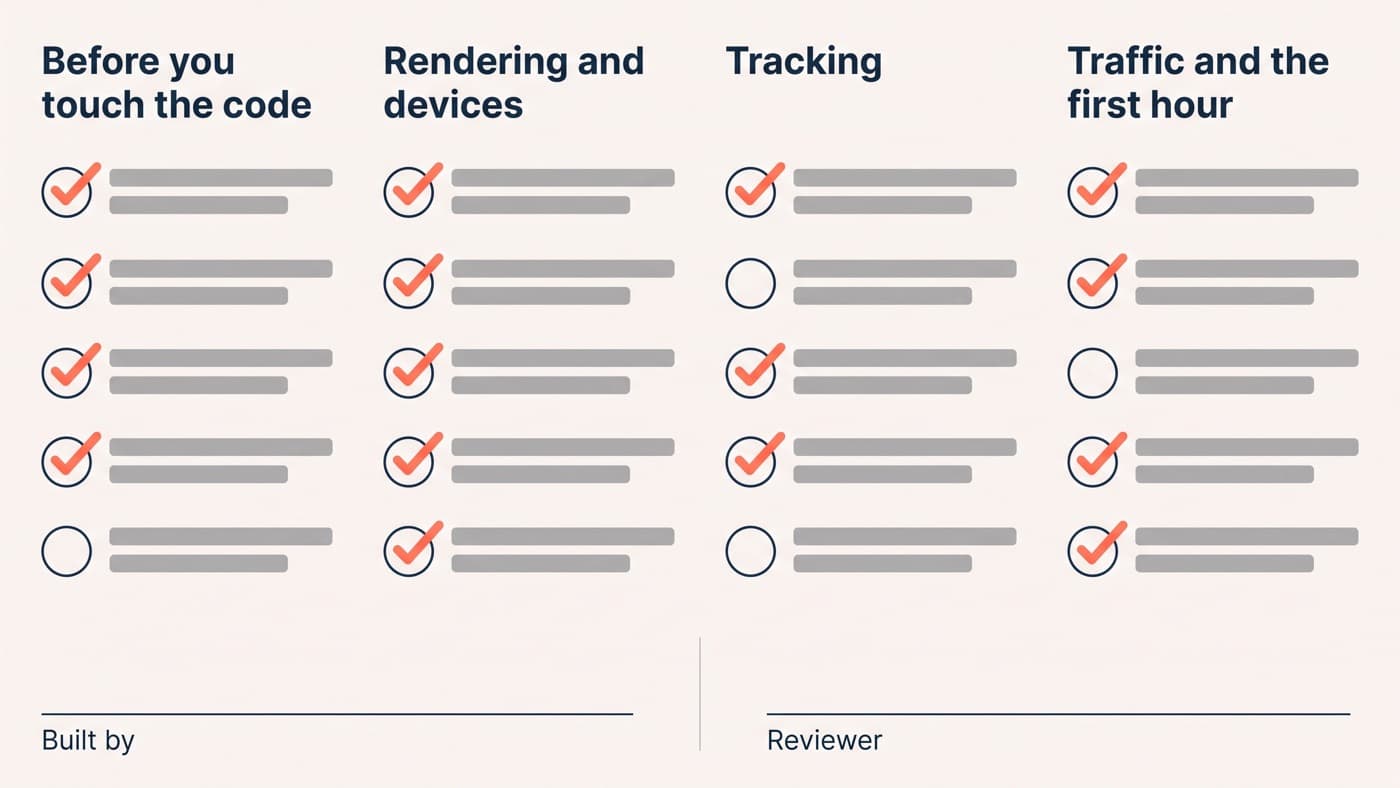
Across the 1640+ tests in our archive, a little over 4% were killed for sample ratio mismatch before they reported, and that figure flatters us: every one of those builds had already passed a pre-launch QA checklist with an assignment check on the first day of traffic. On tests we inherit from teams where nobody was checking, roughly one in eight arrives with a ratio that fails at p below 0.001. The gap between those two rates is not talent. It is whether anyone looked while looking was still cheap.
That is the whole argument for treating experiment engineering as a discipline rather than a configuration screen: the check costs two minutes, belongs in the same daily glance as the traffic count, and can be automated to shout at you rather than wait to be asked. If your last three results felt slightly too good, run it before you run another test, and if you would rather hand the discipline to a team that already runs it on every build, get in touch.