A feature flag answers can we ship this safely. An A/B test answers should we ship this at all. They run on the same plumbing, which is why teams confuse them, and the confusion has a recognisable signature: a percentage rollout, no control group held, a before-and-after chart, and somebody in the readout using the word data.
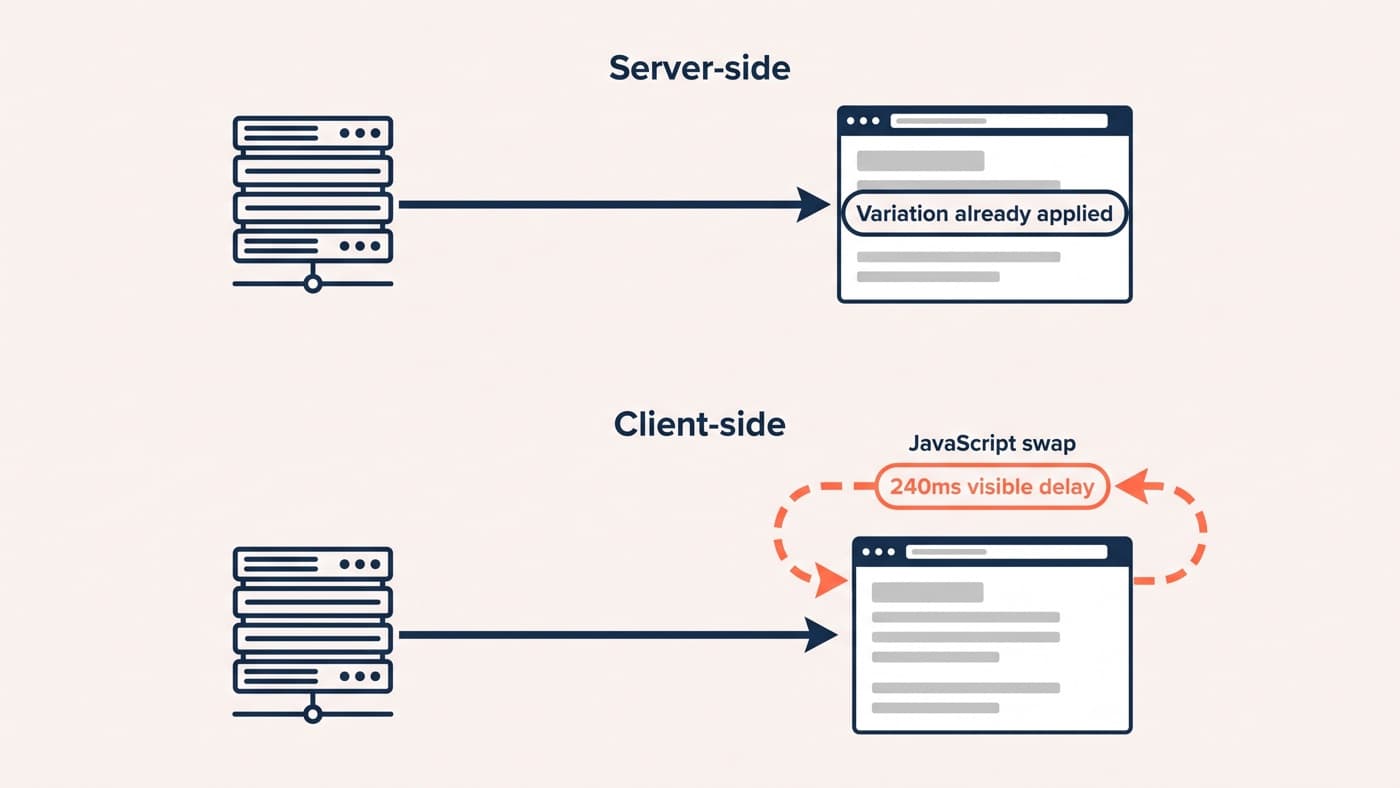
This is not the client-side against server-side argument, which is about where the code runs and is settled in its own guide. This is one layer up: which question you asked. Get the transport right and the question wrong and you have a beautifully engineered way of learning nothing.
Two questions that happen to share a pipe
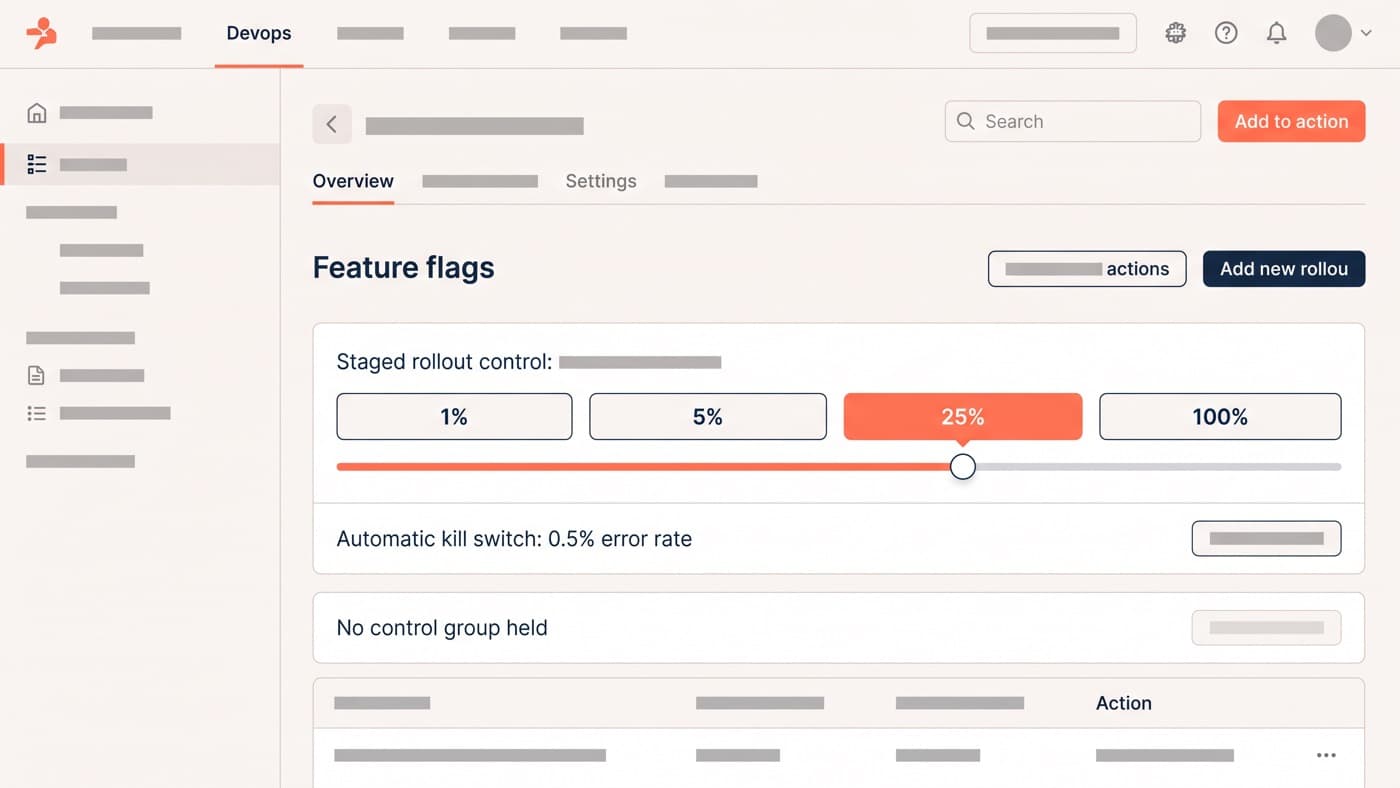
Both mechanisms need the same three things: a way to decide which user gets which code path, a way to change that decision without a deploy, and a kill switch. That shared requirement is why one vendor can sell you both, and why the distinction gets lost. A flag exists to control exposure. Its success condition is that nothing broke, and its natural behaviour is to ramp: 1% of users, then 5%, then 25%, then 100%, with the operator watching error rates and latency at each step. An experiment exists to attribute a difference to a cause. Its success condition is a readable comparison, which requires a control group running at the same moment, under the same conditions, on a randomly assigned split.
The asymmetry is the whole thing. A flag wants exposure to move as confidence grows. An experiment needs exposure to sit perfectly still, because a split that changes mid-flight mixes populations across time and every difference you then observe is partly the calendar. The two are not opposed, but they cannot both be running on the same allocation at the same moment, and pretending otherwise is where the trouble starts.
Where the confusion costs money
These five patterns account for nearly every case we have been asked to referee after the fact, usually when a rollout is being defended as evidence.
- The staged rollout read as a test. Traffic goes 1%, 5%, 25% then 100% over ten days, and the resulting conversion chart is compared against the previous ten days. Every seasonal, campaign and weekday effect in that window is inside the number, and none of it is separable afterwards.
- The flag with no control held. The new checkout is on for 25% of users and the old one for 75%, but the 75% are never treated as a cohort or measured as one, so there is nothing to compare against except the site average.
- Assignment by convenience. Flags are commonly keyed on something handy: internal users first, then one region, then a device class. That is deliberately not random, which is correct for managing risk and fatal for measurement.
- Ramping mid-experiment. Somebody raises the split from 50% to 80% on day four because the numbers look good. That is peeking and reallocation in a single move, and it makes the result unreadable rather than merely optimistic.
- The flag left on. The rollout finished, nobody removed the flag, and eighteen months later the codebase carries 40 dead flags, one of which is still holding 3% of traffic on a version nobody remembers shipping.
Flag first, then measure
The pattern that works is sequential rather than simultaneous. Build the change behind a flag. Turn it on for internal users, then 1% of real traffic, with an automatic kill switch set to something concrete such as a 0.5% error rate on the affected route. When the code has proved it will not fall over, stop ramping and freeze the flag at a fixed 50/50 split with randomised assignment. That is now an experiment, and it runs untouched until it reaches the sample it was planned for. Afterwards, ramp to 100% under the same flag, and keep the flag in place for a month as a one-click rollback.
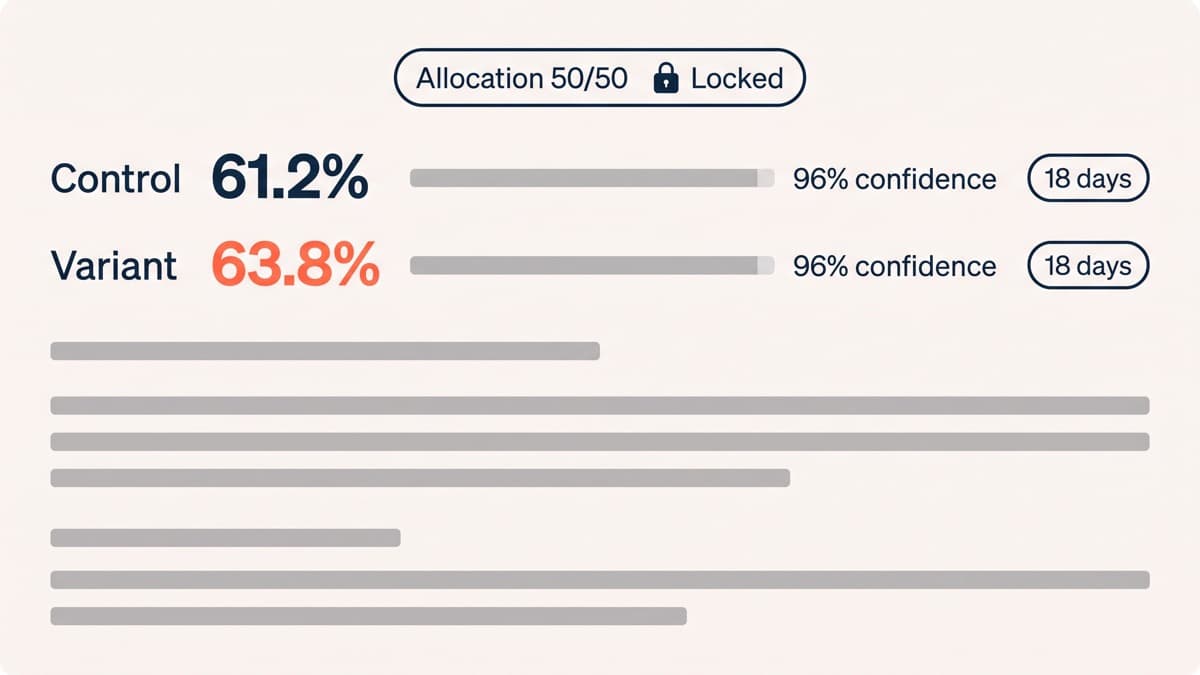
A checkout rewrite we ran that way spent its first week ramping under the flag and then sat at a locked 50/50 for 18 days: 61.2% checkout completion on the control against 63.8% on the variant, at 96% confidence. Neither number would have existed under a pure rollout, because there would have been no simultaneous control to read against. The reverse order is equally legitimate: prototype a cheap client-side version, measure it, and only then build the real thing behind a flag. Which order you choose depends on whether the larger unknown is safety or value, and naming that at the brief stage is most of the skill.
When you only need one of them
A flag on its own is right when there is no user-visible choice to make. Swapping a payment provider behind an identical interface, migrating a search backend, or replacing a template engine are all risk problems with no meaningful question about whether to do it. The same is true when the change is mandatory: a tax display rule or a consent banner ships regardless of what a test says, so measuring it only buys you a number you cannot act on. An experiment on its own is right when the change carries no deployment risk at all, which covers most copy, layout and merchandising work, and that boundary between reversible content and real engineering is the line CRO development is drawn around.
The genuinely hard case is the change that carries both problems at once. A checkout rewrite is risky to deploy and uncertain in value, and the instinct is to pick one mechanism and hope the other question answers itself. It never does. A rollout with no control leaves you unable to say whether completion moved, and an experiment with no flag leaves you unable to stop quickly when a payment method breaks at two in the morning. Both, in sequence, is the only honest answer, and it costs a week of calendar rather than a week of engineering.
Tooling overlap, and what to demand
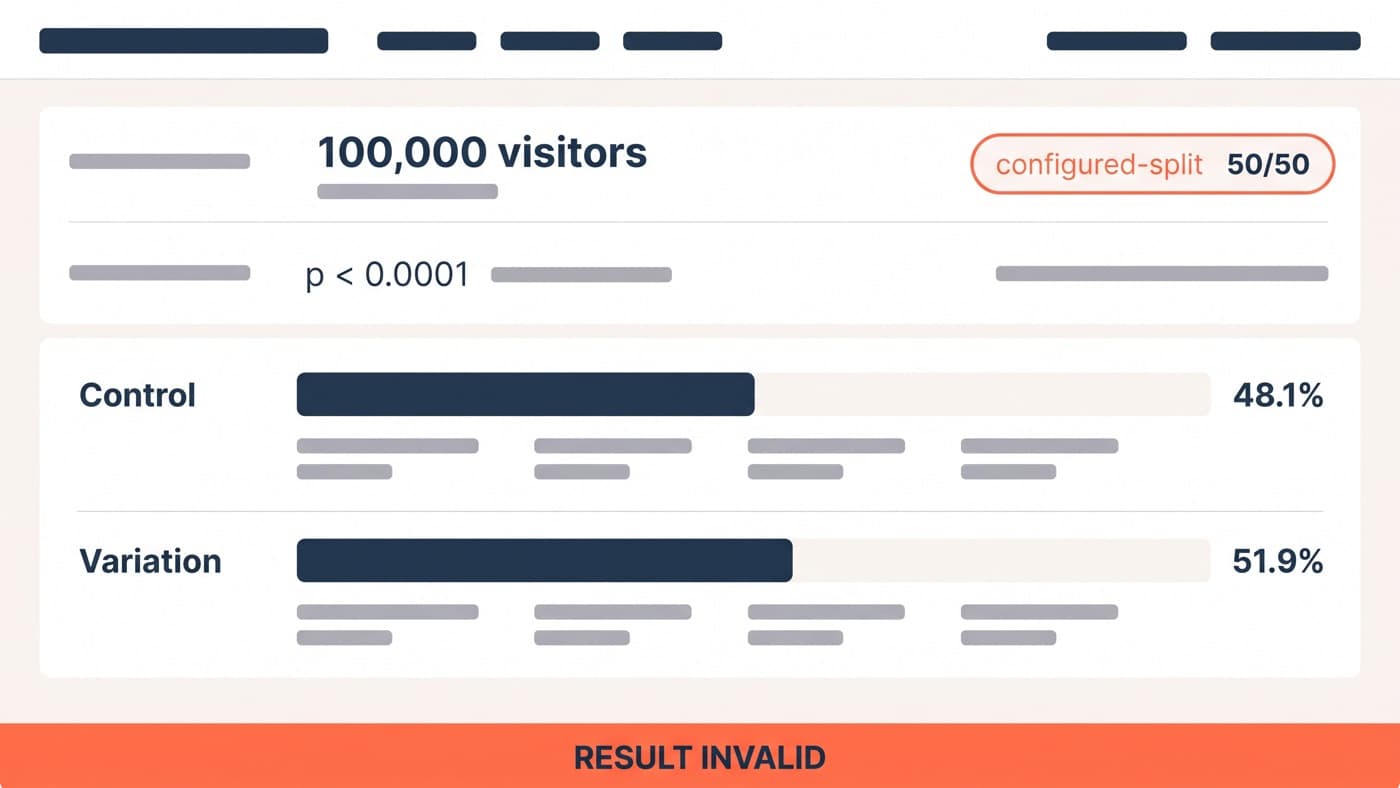
Most experimentation platforms now sell flags and most flag vendors now sell experiments, so the buying decision rarely turns on features. It turns on whether the analysis half is real. Demand four things: a fixed-allocation mode that refuses to reallocate while a test is running, exposure events logged at assignment rather than at render, an automatic sample ratio mismatch check on every experiment, and an export of the raw assignment list so you can do your own arithmetic. A tool that cannot give you the last one is a tool that owns your evidence.
The short version is worth pinning somewhere a team will see it: flags decide who is exposed, experiments decide what it was worth, and only one of them is allowed to move while you are measuring. If your last few rollouts produced charts rather than results, that is the thing to fix first, and it is the kind of plumbing our A/B test development work exists to sort out. Get in touch with the rollout you are least sure about.