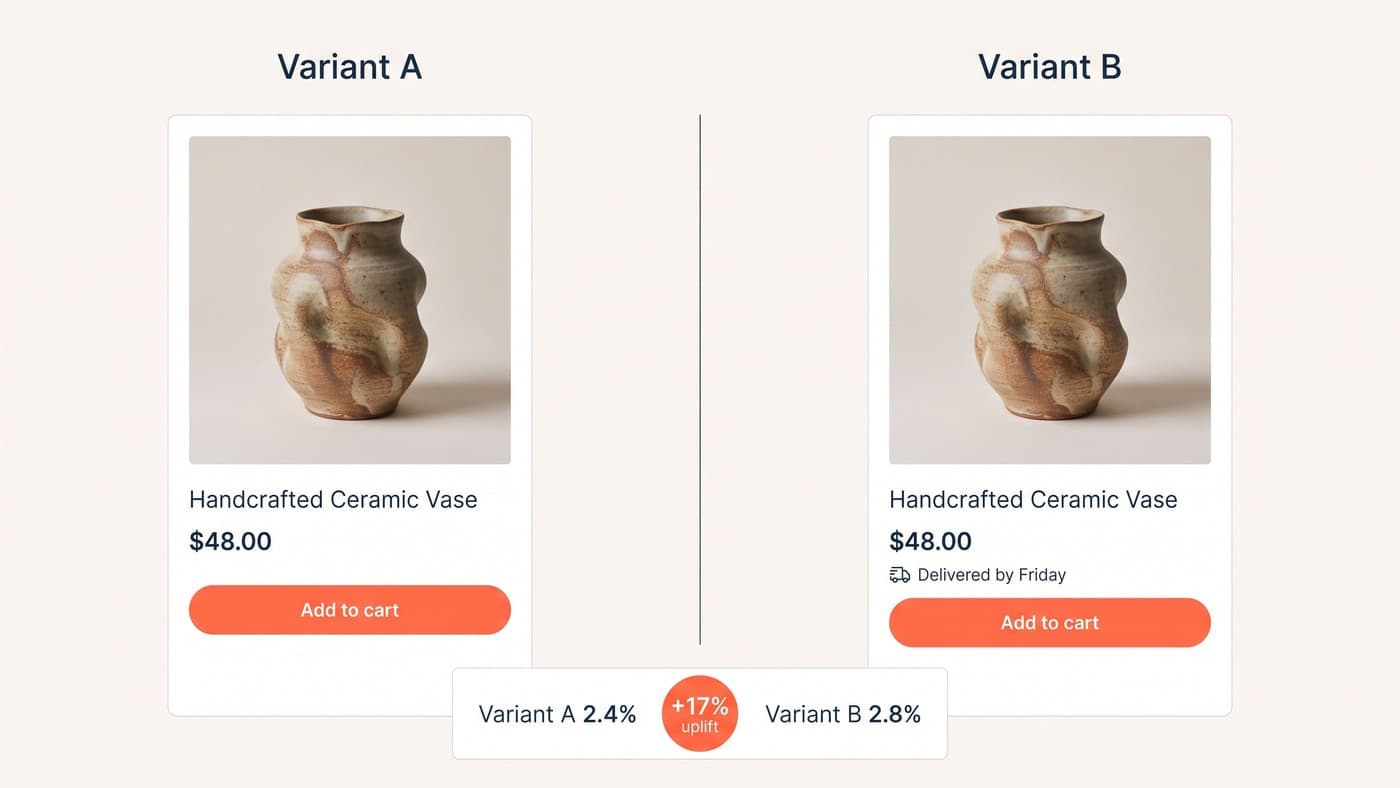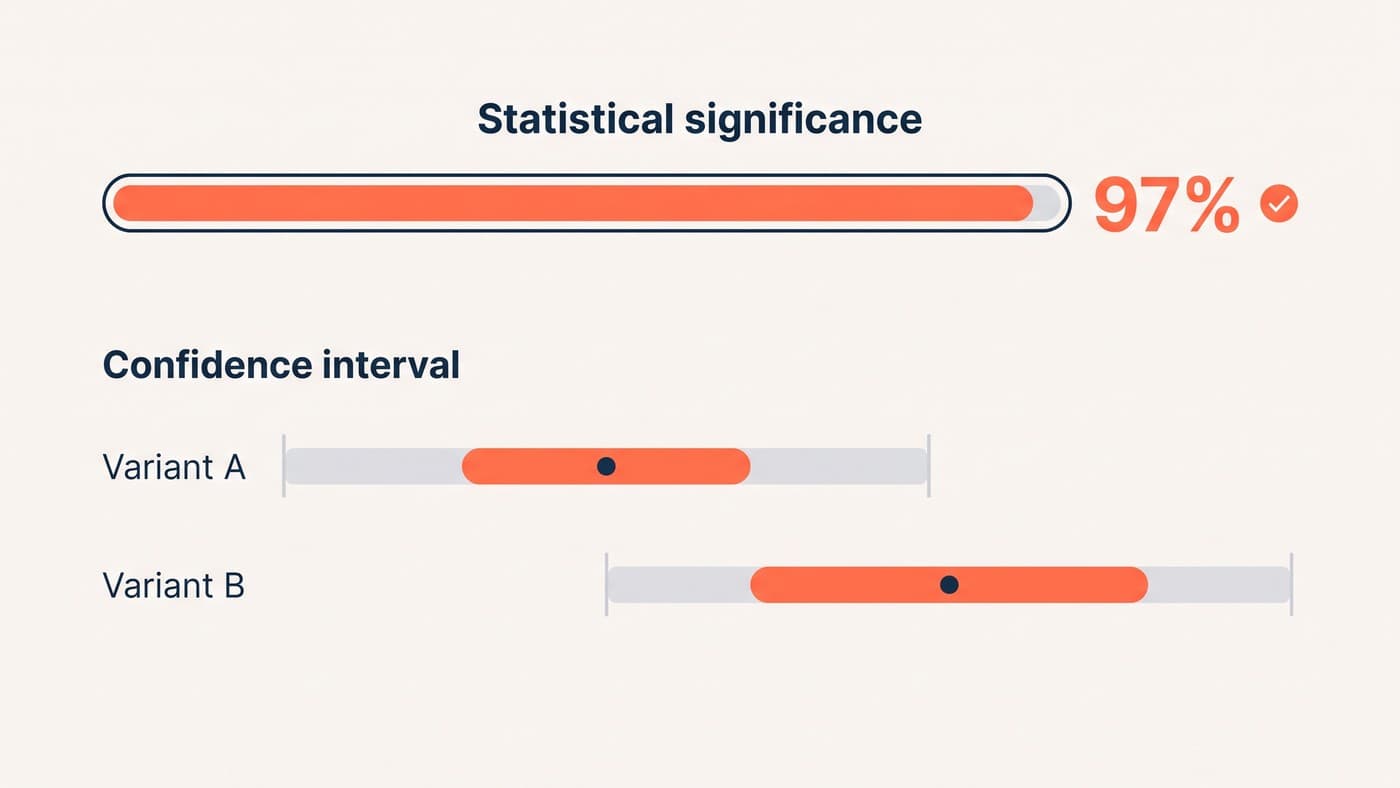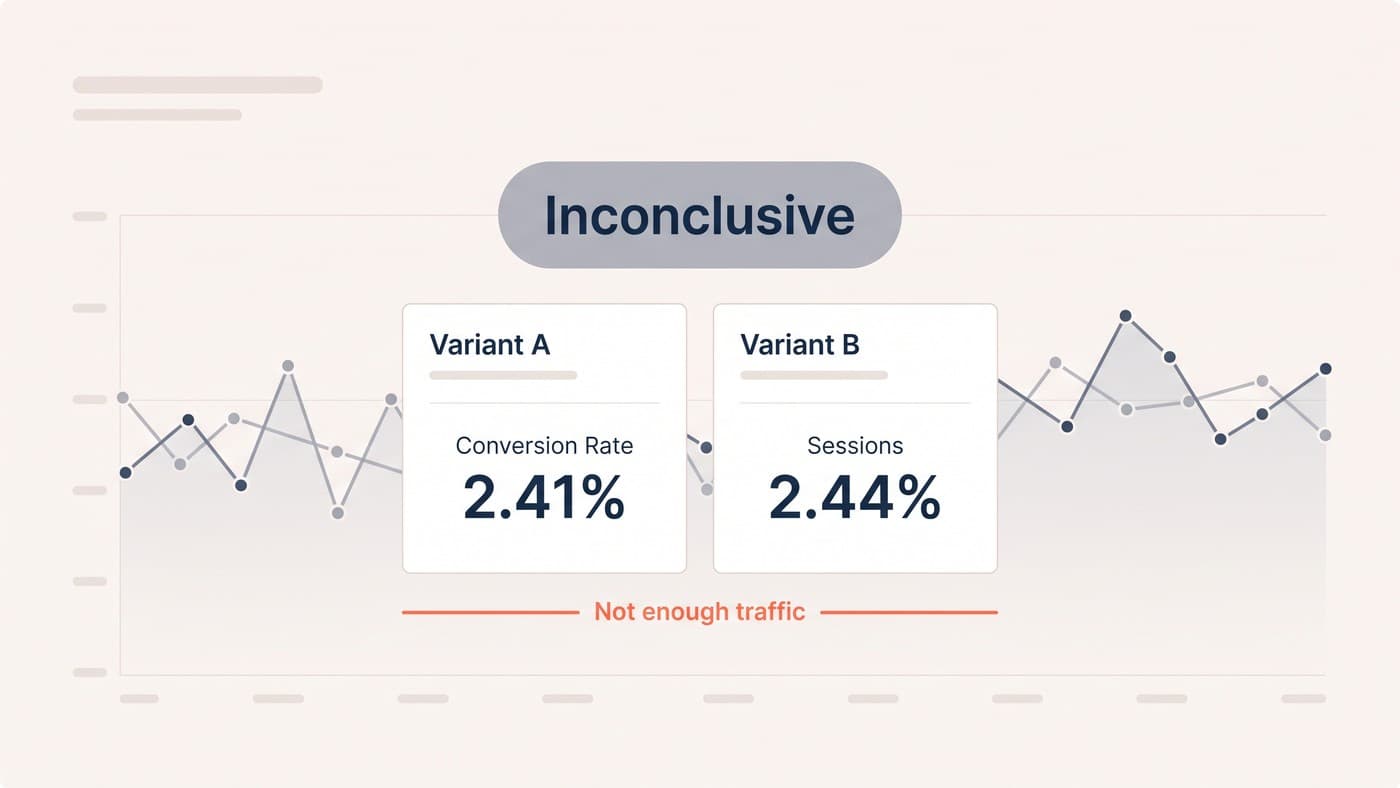
The most expensive number in your testing programme is the one nobody calculated. Sample size decides, before a single visitor sees your variant, whether the test can produce an answer at all — and it is routinely worked out after the design is signed off, if it is worked out at all.
The consequence is not a wrong answer. It is a flat one. Underpowered tests come back inconclusive, get filed as losses, and quietly teach the team something false about their customers.
What sample size actually tells you
Sample size is the number of visitors each variant needs before a real difference would be visible above the noise. Conversion data is noisy: two identical pages shown to two random groups will always produce slightly different rates. The question is how much traffic you need before a gap stops being plausible as chance.
Smaller differences hide more easily, so they need more traffic. This is the part that catches people out — a test looking for a 20% lift is cheap to run, and a test looking for a 3% lift can be effectively impossible on the same page.
The four numbers you need
Every calculator, however it dresses them up, asks for the same four things:
- Baseline conversion rate — what the control does today. Take it from the last full month for that exact template, not a site-wide average.
- Minimum detectable effect — the smallest relative lift you would act on. Not the lift you hope for; the one that would change a decision.
- Statistical power — conventionally 80%, meaning you would catch a real effect four times out of five.
- Significance threshold — conventionally 95%, the false-positive rate you will tolerate.
Only the first is a fact. The other three are choices, and pretending they are fixed constants is how programmes end up with unrunnable tests.
A worked example, with real consequences
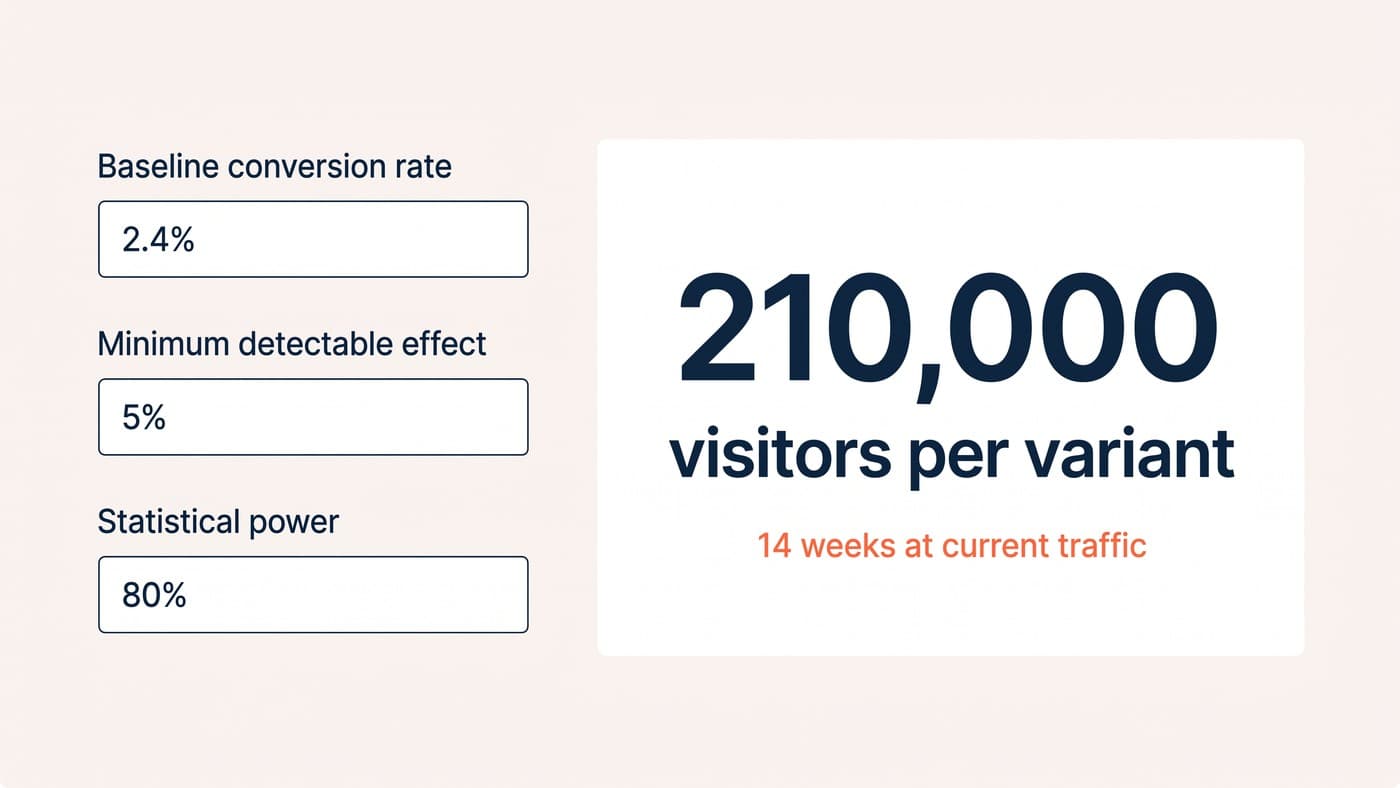
Take a product page converting at 2.4%. You want to detect a 5% relative lift — 2.4% becoming 2.52%. At 80% power and 95% significance, that needs roughly 210,000 visitors per variant, so about 420,000 in total.
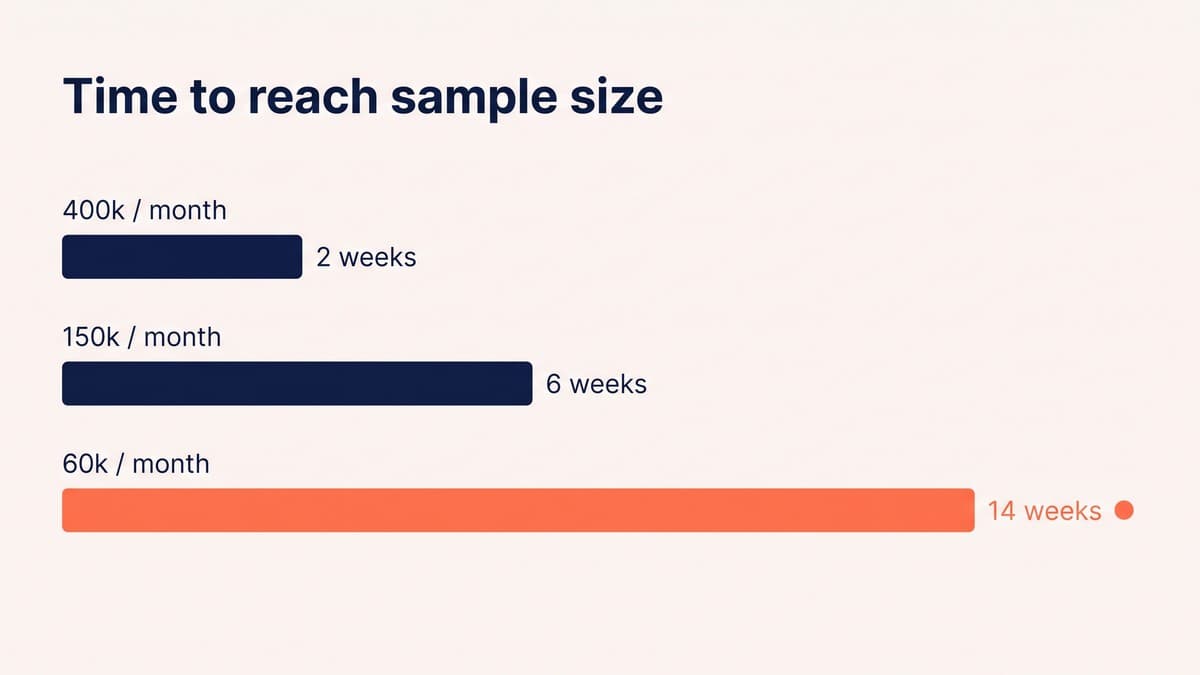
If that template sees 30,000 visitors a month, the test needs fourteen months. Nobody runs a fourteen-month test. What actually happens is that it runs for three weeks, shows a muddle, and gets recorded as "no effect" — which is a completely different statement from "we could not have detected an effect this size".
Now change one input. Look for a 15% lift instead and the requirement drops to roughly 24,000 per variant — about seven weeks. Same page, same traffic, same maths. The test became possible because the ambition got honest. This is the calculation we run before briefing any A/B testing work, and it is the fastest way to kill an expensive idea cheaply.
When the maths says no
You have three honest options and one dishonest one. Test a bigger change, since large effects need far less traffic. Test somewhere busier — collection pages and carts see far more people than any single product page. Or aggregate: run the test across a template family rather than one URL.
The dishonest option is to run it anyway and read the result. If you take one thing from this piece, take that a test you knew was underpowered does not become informative because it finished.
Are 95% and 80% actually your numbers?
The two conventions everyone inherits — 95% significance, 80% power — come from academic publishing, where a false positive costs a retracted paper and a career. Your context is different, and treating them as physical constants quietly rules out tests you could reasonably run.
Ask what being wrong actually costs. Shipping a losing variant of a button label costs a fortnight and a revert. Shipping a losing checkout redesign costs a quarter. The first can tolerate 90% significance; the second probably deserves more than 95%, not less.
Relaxing the threshold to 90% on low-stakes tests cuts the required sample by roughly a quarter, which is often the difference between a test that fits in a month and one that does not. What matters is deciding this before you launch and writing it down, because a threshold chosen after seeing the data is not a threshold — it is a justification.
The same logic applies to power. At 80% you miss a real effect one time in five, which is a lot of wasted development if the change was genuinely good. On expensive builds we push power to 90% and accept the larger sample, because the cost of quietly discarding a winner exceeds the cost of the extra fortnight.
The ways people quietly fudge it
Watch for these, because they all produce a number that looks rigorous and is not. Using a site-wide conversion rate as the baseline for a single template inflates the baseline and understates the traffic you need. Counting sessions where the calculator assumes visitors double-counts returning users. Switching the metric mid-test from orders to add-to-carts because the second one moved is choosing your evidence after seeing it.
And the most common of all: stopping early because the dashboard went green. That is a significance problem rather than a sample-size one, and it is worth understanding on its own — see our piece on statistical significance.
One last habit worth building: record the calculation alongside the test, not in somebody's spreadsheet. Six months later, when a colleague asks why a page was never tested, the answer should be a number they can check rather than a memory of a conversation.
Keep the assumptions with it, not just the answer. A baseline taken from a quiet January behaves very differently from one taken in peak season, and the same calculation run against the wrong month can be out by weeks.
It also protects you from the most awkward version of this conversation, which is being asked to explain an inconclusive result to somebody who was never told the test was underpowered. Writing the maths down in advance turns that from a failure into a decision everybody had already agreed to.
Do the calculation first. It takes four minutes, it is the cheapest thing in the whole process, and it is the only step that can tell you not to bother. If you want a second opinion on whether your traffic can support the roadmap you have got, get in touch.