95% significance does not mean there is a 95% chance your variant is better. Almost everybody reading a test dashboard believes it does, including people who have been running tests for years, and that single misunderstanding is behind most of the bad calls we get asked to review.
You do not need the maths to run good experiments. You do need to know what the number is answering, because it is not the question you are asking.
What the number actually says
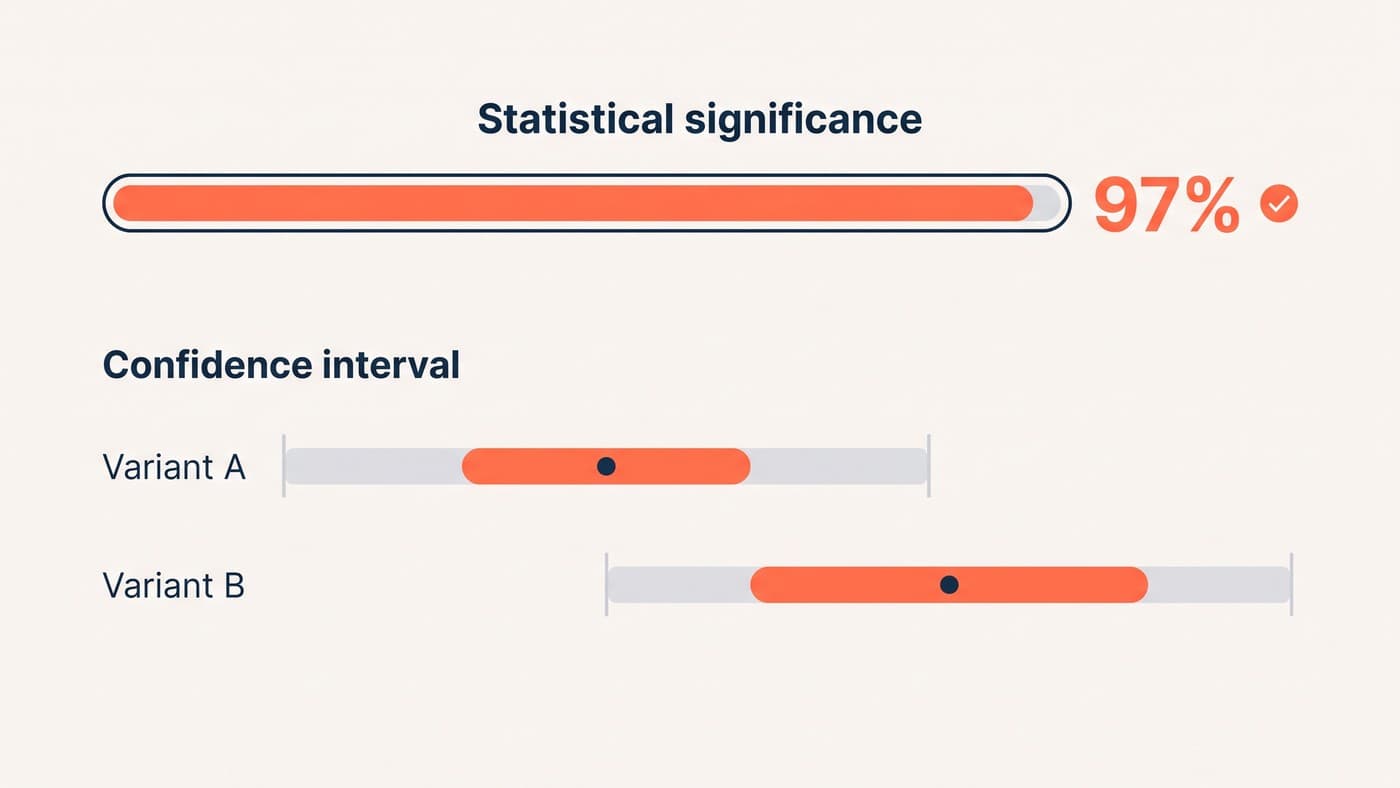
Statistical significance answers a deliberately narrow question: if the two variants were genuinely identical, how often would random chance alone produce a gap at least as big as the one I am looking at?
At 95% significance, the answer is "about one time in twenty". That is a statement about how surprising your data would be in a world where the change did nothing. It is not a probability that your change works, and the difference matters, because run twenty tests on changes that do nothing and roughly one of them will hand you a convincing-looking winner.
Confidence intervals are the more useful number
Significance gives you a yes or no. A confidence interval gives you a range, and ranges are what business decisions actually need.
"Variant B wins, +8%" tells you almost nothing on its own. "Variant B is somewhere between +1% and +15%, most likely around +8%" tells you whether it is worth the engineering time. Two tests can both be significant while one promises a rounding error and the other promises a quarter.
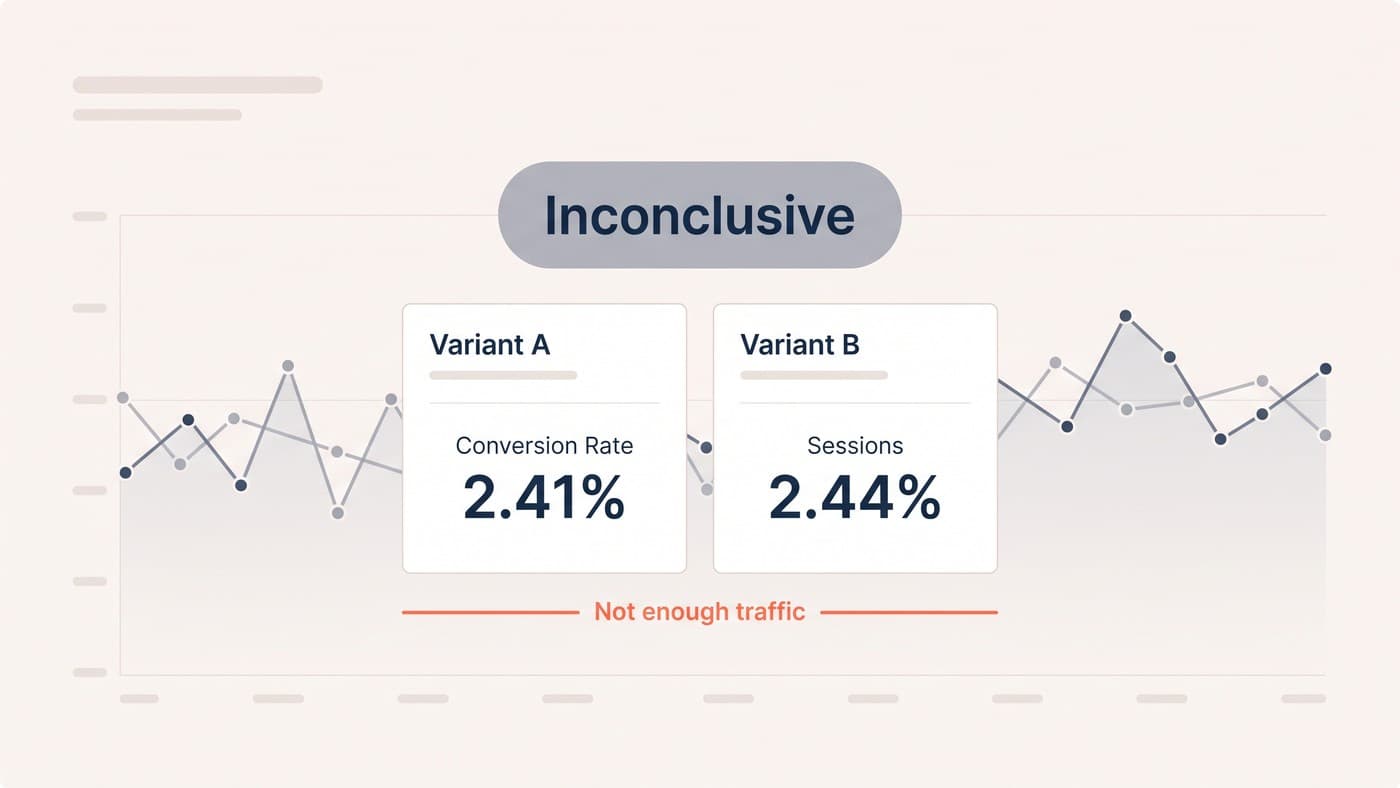
Wide intervals are also the honest signal that you under-powered the test. If the range spans from "barely anything" to "enormous", you have not learned the size of the effect, only its direction — and the size is the part you were going to act on.
Why peeking breaks the guarantee
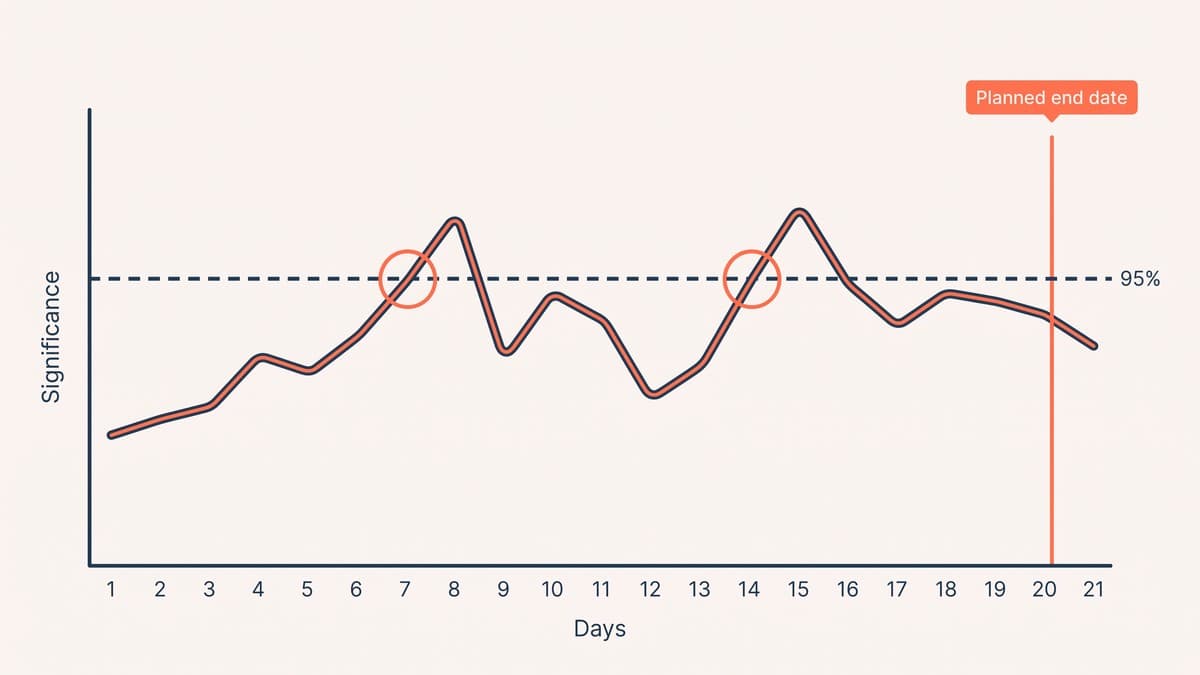
The one-in-twenty false-positive rate holds only if you look once, at a point decided in advance. Check every morning and stop the first time it goes green, and you are no longer running one test — you are running fourteen, and taking the most flattering result.
In practice this pushes the real false-positive rate well past one in five. It is the statistical equivalent of flipping a coin until you hit five heads in a row, then announcing the coin is loaded.
The fix costs nothing: fix the runtime and the sample size before launch, and do not touch the result until then. We hide dashboards from clients for the first week, not to be difficult, but because seeing an early number is genuinely hard to un-see.
Run whole weeks, always
Tuesday buyers do not behave like Sunday buyers. Payday weeks do not behave like the week before. A test that starts on a Monday and ends on a Thursday has silently weighted its own result towards whoever happens to shop midweek.
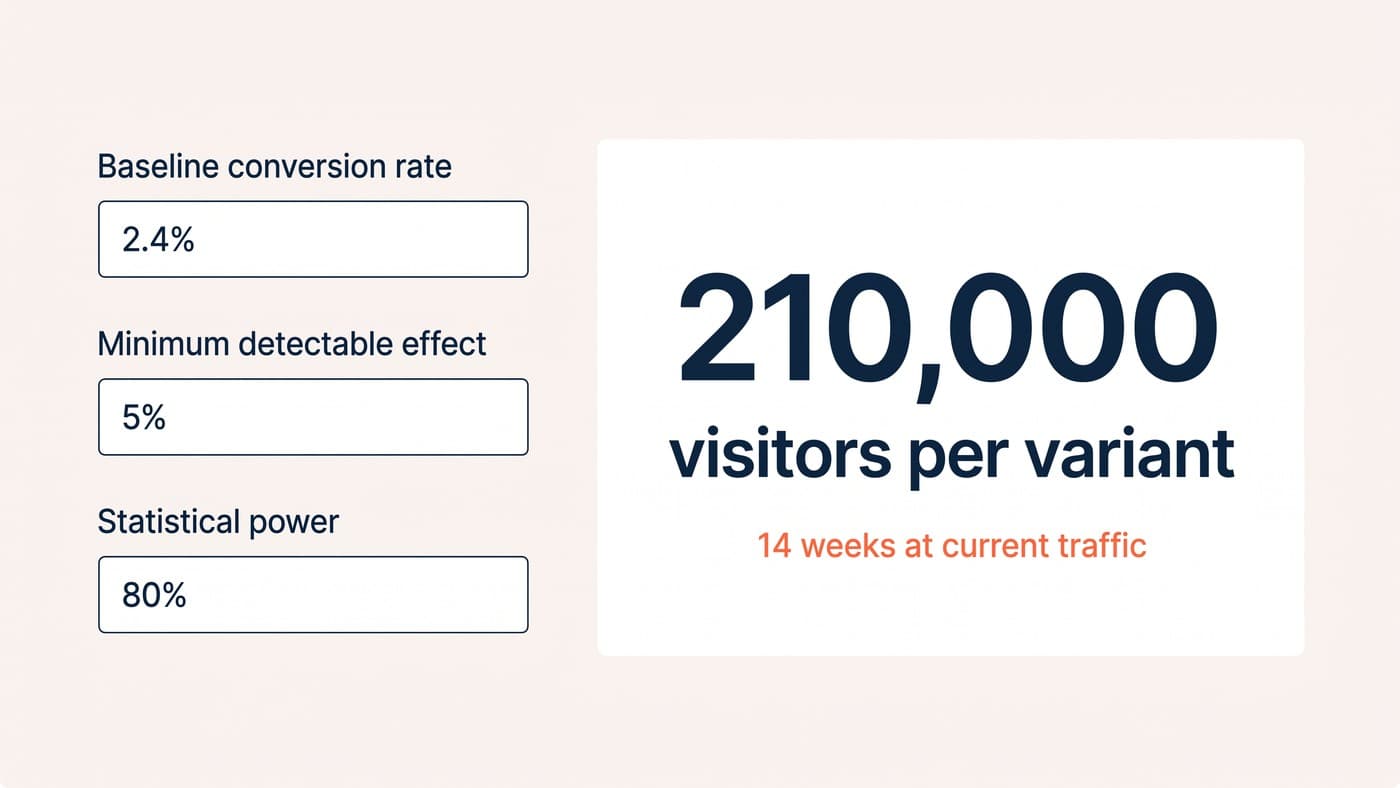
Run in complete seven-day blocks, and where budget allows, a minimum of two. One week can be an anomaly; two weeks that agree with each other rarely are. This pairs directly with getting the sample-size maths right up front, which is the other half of the same discipline.
Statistically significant is not the same as worth doing
Given enough traffic, almost any change becomes statistically significant. On a site doing millions of sessions a month, a 0.3% relative improvement will clear 95% comfortably — and be completely worthless, because it will not survive the engineering cost of maintaining it.
This is why the minimum detectable effect belongs in the plan alongside the significance threshold. Decide in advance the smallest lift that would actually change what you do. Anything below it is a result you should ignore even when the maths says it is real.
Large stores get this wrong in one direction and small stores in the other. High-traffic teams ship a stream of significant, meaningless changes and wonder why the annual number has not moved. Low-traffic teams dismiss genuinely large effects as noise because they never had the sample to confirm them. Both problems come from reading significance without reference to size.
Pick one metric and mean it
The other way significance quietly breaks is through the back door: tracking fifteen metrics and reporting whichever moved. With fifteen metrics at 95%, the chance that at least one shows a false positive is better than even.
Name one primary metric before launch and let it decide. Everything else is a diagnostic — useful for understanding why something happened, never for deciding whether it did. If the primary metric is flat and a secondary one moved, that is a hypothesis for the next test, not a win for this one.
What we actually report
Every readout we send a client carries the same five things, because any one of them missing lets a bad decision through:
- The hypothesis as written before launch, unedited.
- The primary metric, named in advance, and only that one for the decision.
- The observed effect with its confidence interval, not just a single headline number.
- The planned runtime and whether we stuck to it.
- A plain-English recommendation: ship, kill, or iterate — and why.
If you take one habit from this, make it writing the decision rule before launch: what number, on what metric, over what period, would make us ship. A rule written in advance is a rule you can be held to; a rule written afterwards is a description of what you already wanted to do.
Worth saying too: none of this requires expensive tooling. A spreadsheet, an agreed end date and somebody willing to say "we said two weeks" out loud will outperform a platform nobody reads the output of. The discipline is the product; the software just renders it.
Everything else here follows from that. Peeking stops mattering because the end date is fixed. Metric-shopping stops mattering because the metric is named. And the confidence interval becomes the interesting part of the readout rather than a decoration beside the verdict.
None of that requires a statistics degree to read, which is the point. If a readout cannot survive a sceptical finance director asking "how sure are you, and how much is it worth", it is decoration. If you want us to look at how yours are being reported, get in touch.