Conversion rate can rise while your revenue falls. Discount harder and watch it happen: more people buy, each of them buys less, and the dashboard congratulates you. Revenue per visitor is the metric that cannot be gamed in that direction, which is why it is the only one we let call a test.
This is a post about a referee, not about tactics. What RPV is, why it settles arguments that conversion rate starts, what it costs you in sample size, and the handful of situations where it is the wrong number to trust.
The formula, and the two ways to read it
Revenue per visitor is total revenue divided by total visitors across the same window. It can also be computed as conversion rate multiplied by average order value, and the two definitions agree, which is the useful part: RPV is the product of the two metrics most teams optimise separately. A store converting 2.4% of its visitors at a £68 average order value has an RPV of £1.63. Move conversion to 2.6% without touching order value and RPV goes to £1.77. Move order value to £74 without touching conversion and it goes to £1.78. One number, both levers, no way to win it by cannibalising one with the other.
Two definitional choices matter and should be made once, in writing. Use visitors rather than sessions, or the metric drifts every time a marketing channel changes how often people return. And use net revenue after discounts, before shipping and tax, or a shipping-threshold test will report a lift that never reaches the bank.
The argument it settles
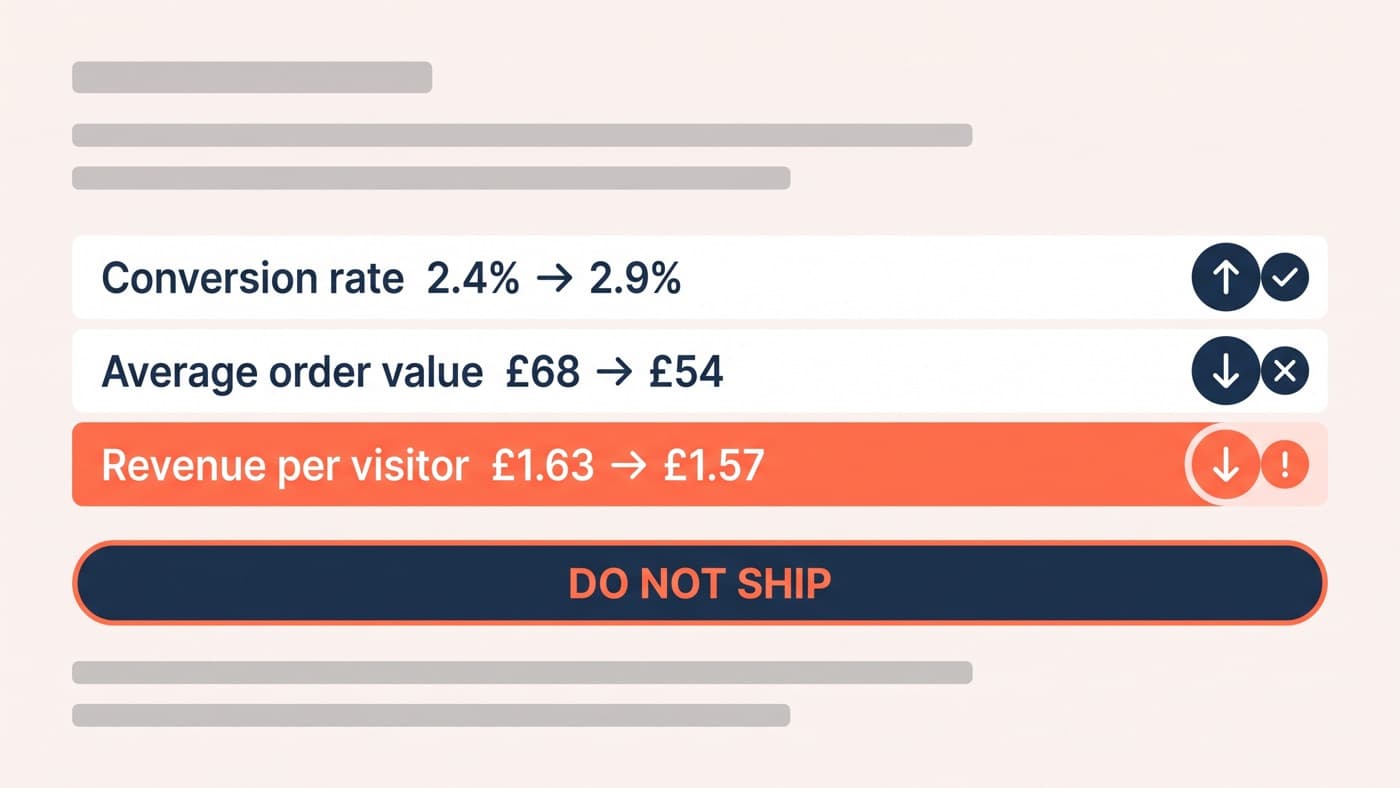
Picture the readout everyone has sat through. The variation added a site-wide discount banner. Conversion rate went from 2.4% to 2.9%, a 21% relative lift with a confident interval behind it, and the room is delighted. Average order value went from £68 to £54, because the discount pulled forward hesitant single-item buyers and shaved the margin off everyone else, and that column is on the second slide. RPV went from £1.63 to £1.57. The test lost 4% of revenue per visitor while winning its headline metric by 21%, and without the RPV column there is no honest way to stop it shipping.
The reverse trap is just as common and quieter. A bundle or a higher-priced default lifts average order value handsomely while suppressing conversion, and the AOV slide looks like a triumph. RPV catches both, because it is the only metric that has to hold both columns at once. That is exactly the referee our guide to increasing average order value uses to grade its tactics: an AOV win that costs conversion is not a win, it is a transfer.
The cost: revenue metrics are noisy
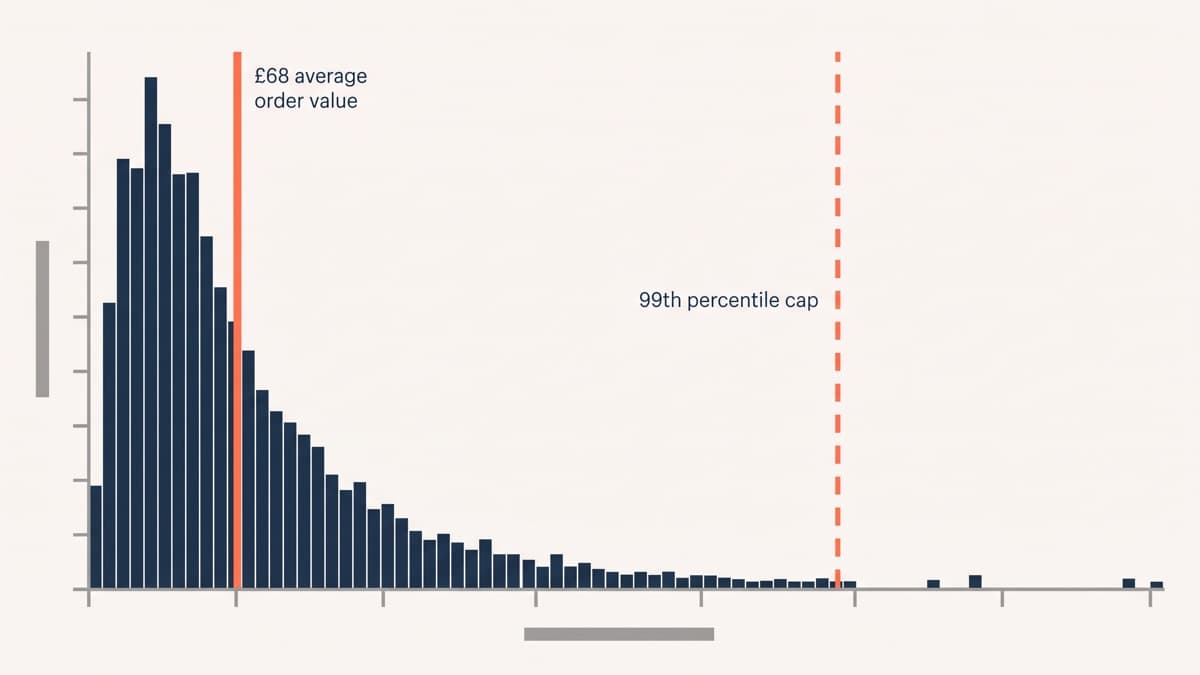
Here is the honest trade-off, and it is the reason RPV is not the default in every tool. A conversion rate is a yes-or-no event with modest variance. Revenue is continuous and violently skewed: most visitors contribute nothing, most buyers contribute a similar amount, and a small number of orders contribute many times the average. That long tail inflates variance, and variance is what sample size pays for. In practice, plan for roughly 1.5 to 2 times the traffic a conversion-rate test on the same effect would need, and expect wider intervals at the end of it.
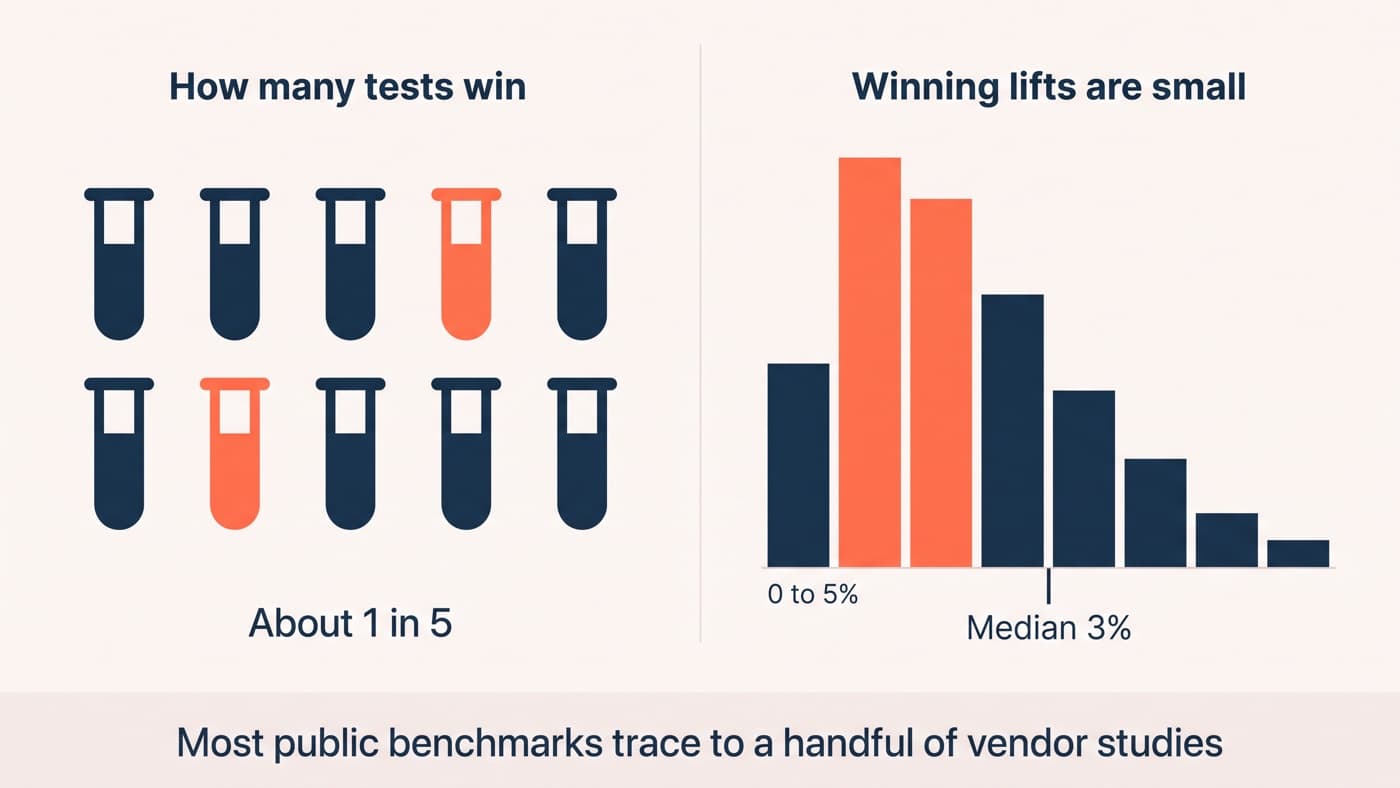
Two practices take most of the sting out. Cap outliers at the 99th percentile of order value before analysis, decided and documented before launch rather than after you have seen which arm the whale landed in. And read the conversion rate and average order value columns alongside RPV rather than instead of it, because when RPV is flat those two columns tell you whether nothing happened or two things happened and cancelled. Our published testing benchmarks are stated on conversion metrics for exactly this reason: revenue benchmarks across different clients and baskets compare almost nothing.
Setting it up without lying to yourself
Every serious testing platform supports a revenue metric, and most of them are configured wrongly on the first attempt. The value must be passed on the purchase event with the right currency, net of discounts, and it must reconcile against the back office for the same transactions before anybody reads a result. Refunds and cancellations are the awkward part: they arrive after the test window, and a variation that lifts RPV by attracting returns-heavy orders is a loss that reports as a win. Where the order volume makes it worth the effort, grade the winner again on refunded revenue thirty days later.
The setup itself is five decisions, each of which should be written down once and then stop being a discussion:
- Denominator: unique visitors bucketed into the test, not sessions and not pageviews, because a change that makes people return more often would otherwise register as a fall in RPV.
- Numerator: net revenue after discounts and before shipping and tax, so a free-shipping threshold test is graded on what the business actually keeps.
- Currency: one reporting currency with a fixed conversion rate for the test window, since a moving exchange rate is noise the experiment did not ask for.
- Outliers: a 99th percentile cap agreed before launch, applied identically to both arms, and stated in the readout alongside the uncapped figure.
- Reconciliation: the test period’s revenue matched against the back office to within a percent before the result is circulated, because a tracking gap is not evenly distributed by default.
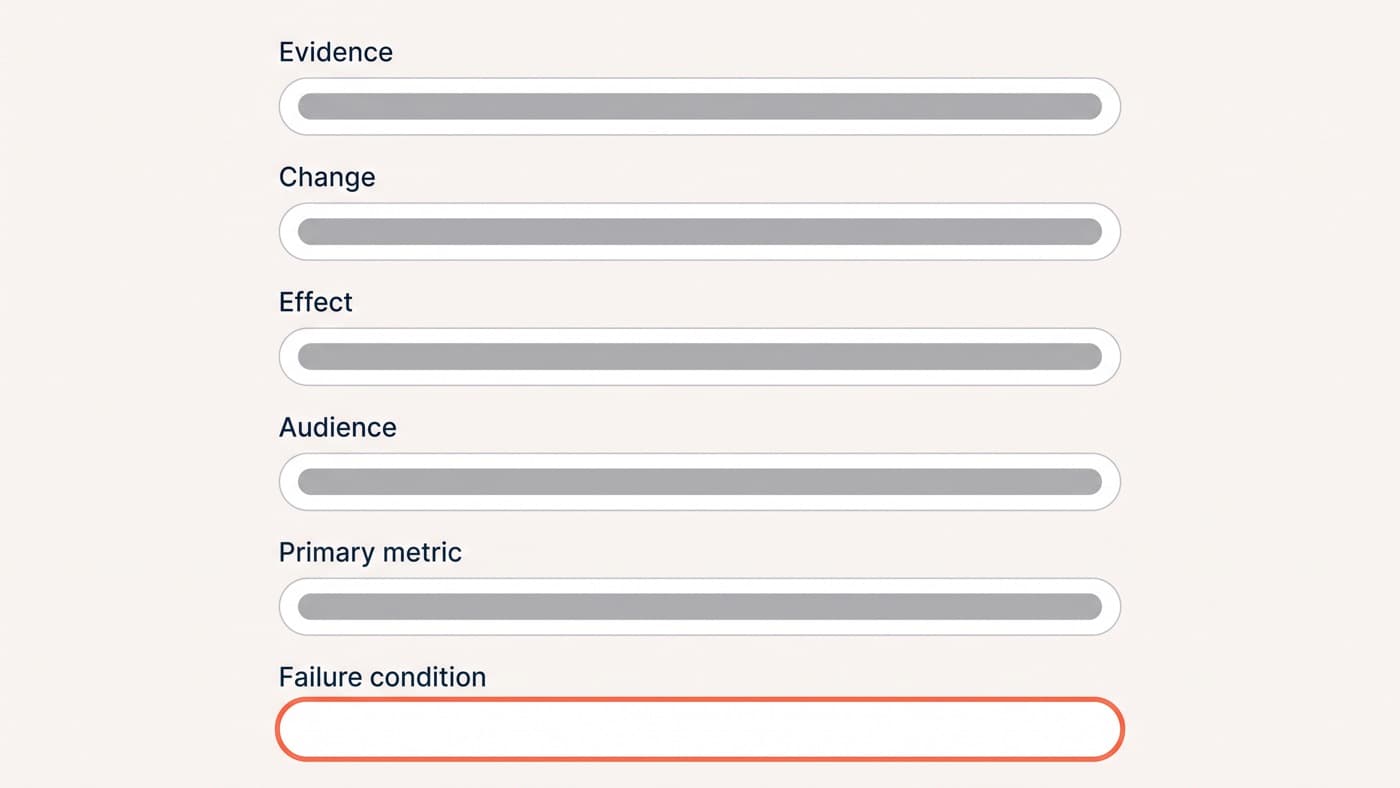
Name RPV as the primary metric while writing the hypothesis, not while reading the results. A metric chosen after the fact is not a metric, it is a verdict looking for a justification, and the whole point of a referee is that it was appointed before the match.
When RPV is the wrong referee
It is not universal. On low-traffic stores the variance makes it unreachable, and a conversion-rate test that can actually conclude beats a revenue test that never will. On tests confined to a single step, a checkout field change for instance, step completion is the cleaner signal and RPV mostly measures the noise of everything downstream. Subscription and high-consideration businesses should be watching a lifetime value proxy instead, because first-order revenue is a poor forecast of the customer. And when a test deliberately trades revenue for something else, a returns reduction or a support-cost cut, RPV will report a loss that the business is happy to take.
Outside those cases, one number decides, everyone knows which number it is before launch, and readouts get considerably shorter. If you want that discipline installed alongside the build capacity to act on it, experiment engineering is where it lives, and we are easy to reach.