Forty-two tests, +18% checkout completion
A note on these case studies
Every brand in these case studies is an illustrative composite, not a client. We built them so a whole engagement could be shown end to end: the brief, the constraints, the tests that lost and the shape of what a programme like this moves. What is real is the method, the failure modes and the way the work runs. The figures illustrate that method rather than reporting one named client’s audited results.
- Checkout completion
- +18%
- from 57.4% to 67.7%
- Mobile checkout completion
- +27%
- from 48.2% to 61.1%
- Tests run
- 42
- 15 winners, 19 flat, 8 losses
- Added revenue, 12 months
- £1.07m
- annualised at a £142 AOV
The brief
What they came to us with
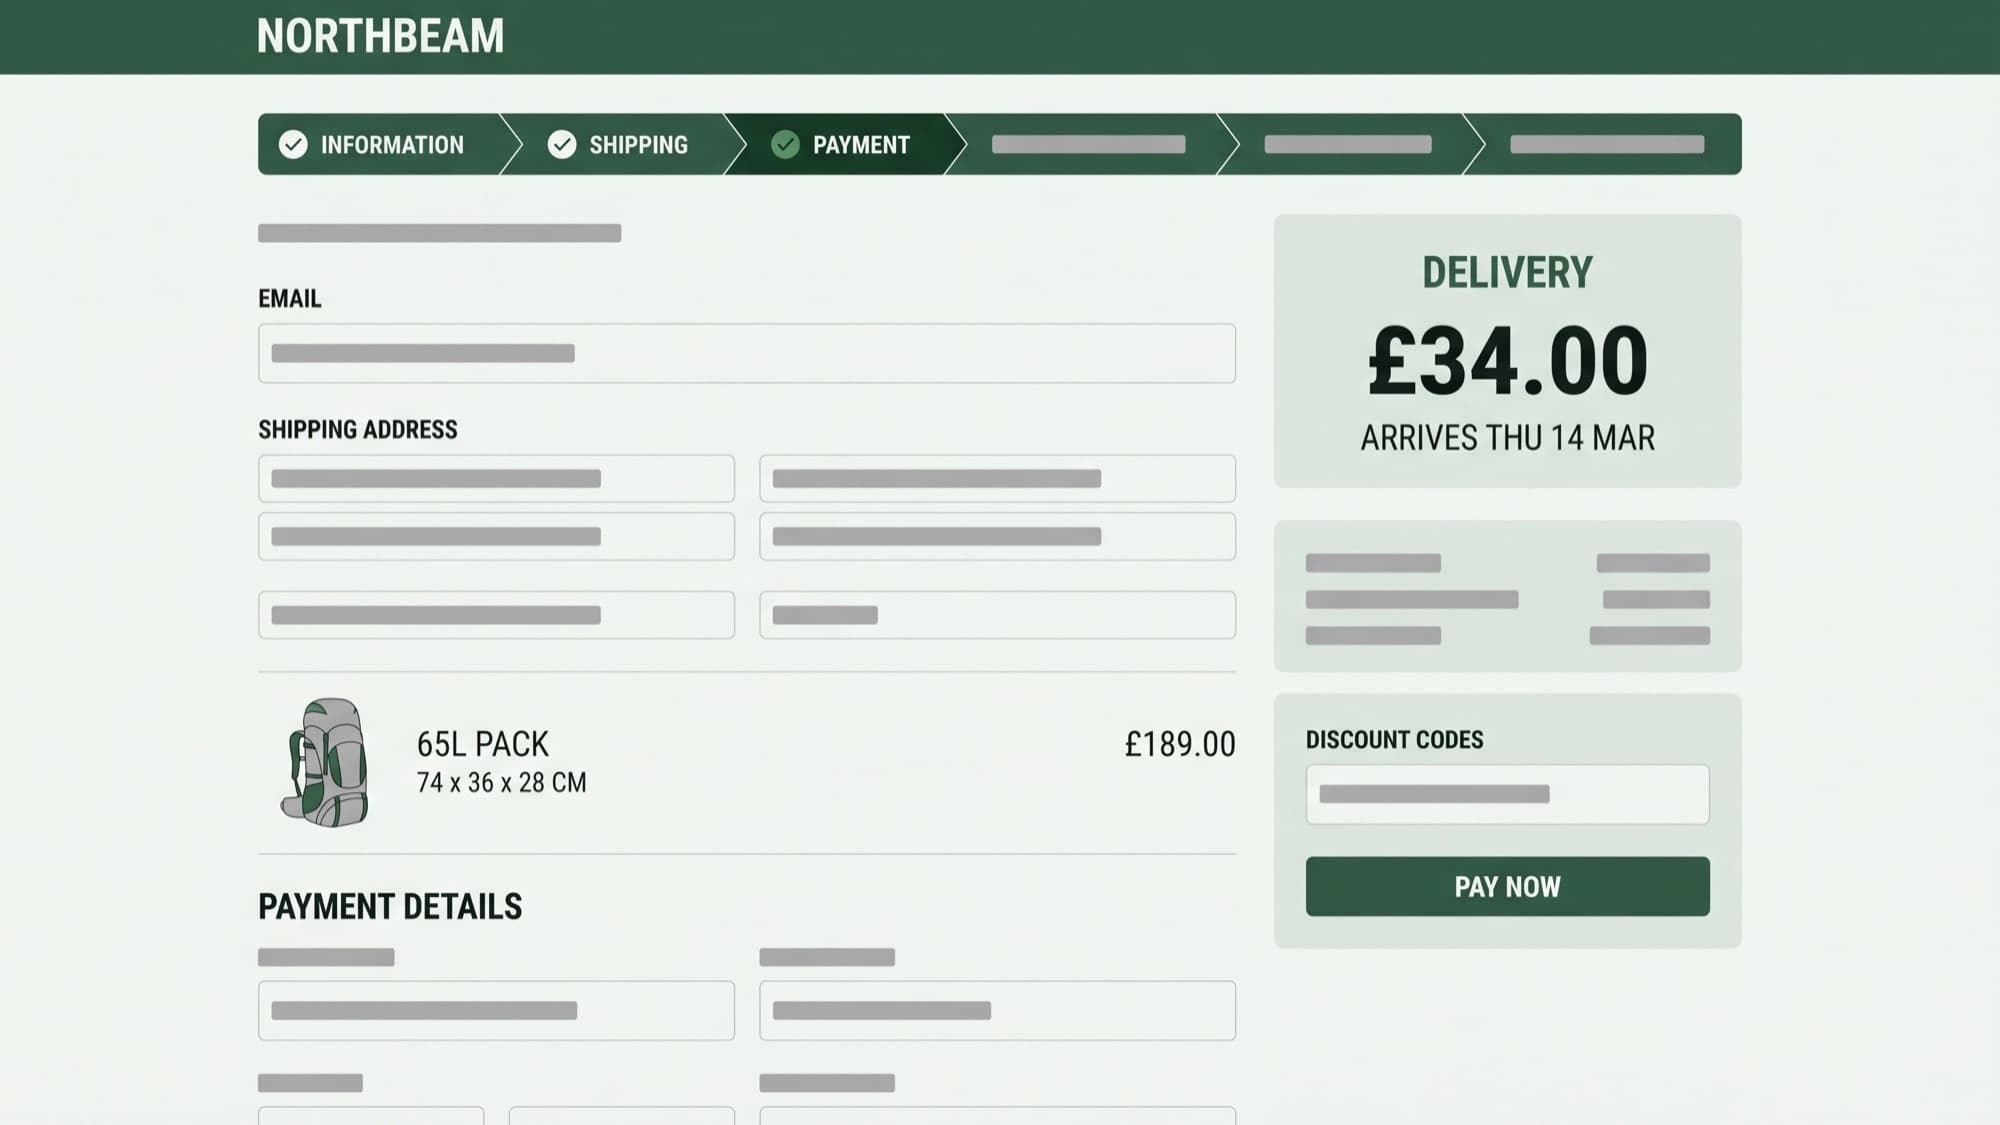
Northbeam Outfitters sells technical outdoor kit (packs, shells, boots, winter hardware) to people who research a purchase for three weeks and then buy it in four minutes. The product pages were good. The merchandising was good. The problem sat entirely after the add-to-cart button: 42.6% of everyone who started checkout never finished it.
That is not an unusual number in retail, which is exactly why nobody inside the business had looked at it hard. The working assumption was price sensitivity. The board had already budgeted for a shipping subsidy on bulky items, on the theory that a 65-litre pack costing £34 to deliver was scaring people off at the last step.
We asked for six weeks before anyone spent that money. What we found was not a price objection. It was an information objection. Shoppers reached the shipping step with no idea what the delivery cost would be, no idea when a bulky item would actually arrive, and no way to check whether a boot in a half size was returnable without leaving checkout. They were not refusing to pay. They were leaving to go and find out, and most of them did not come back.
Constraints
- About 180,000 sessions a month and a 3.4% checkout-start rate, roughly 6,100 checkout entries. Any test below a 4% relative effect was not detectable inside a sensible run time.
- October to January is 54% of annual revenue. A hard code freeze ran from 1 November to 6 January, so the peak we most wanted to influence was the one we could not touch.
- One front-end developer, shared with the wholesale portal. Every winner had to ship as a component the in-house team could own, not as a permanent script injection.
- Checkout lives on Shopify Plus under checkout extensibility, with no Liquid and no legacy checkout scripts. Anything at the payment step had to be a UI extension or it did not exist.
The approach
How we worked the problem
The research phase was deliberately unglamorous: buy things, watch people buy things, and read the warehouse data nobody in marketing had opened. The roadmap fell out of it in about a day.
- 01
Reconstruct the drop-off from order data, not from analytics
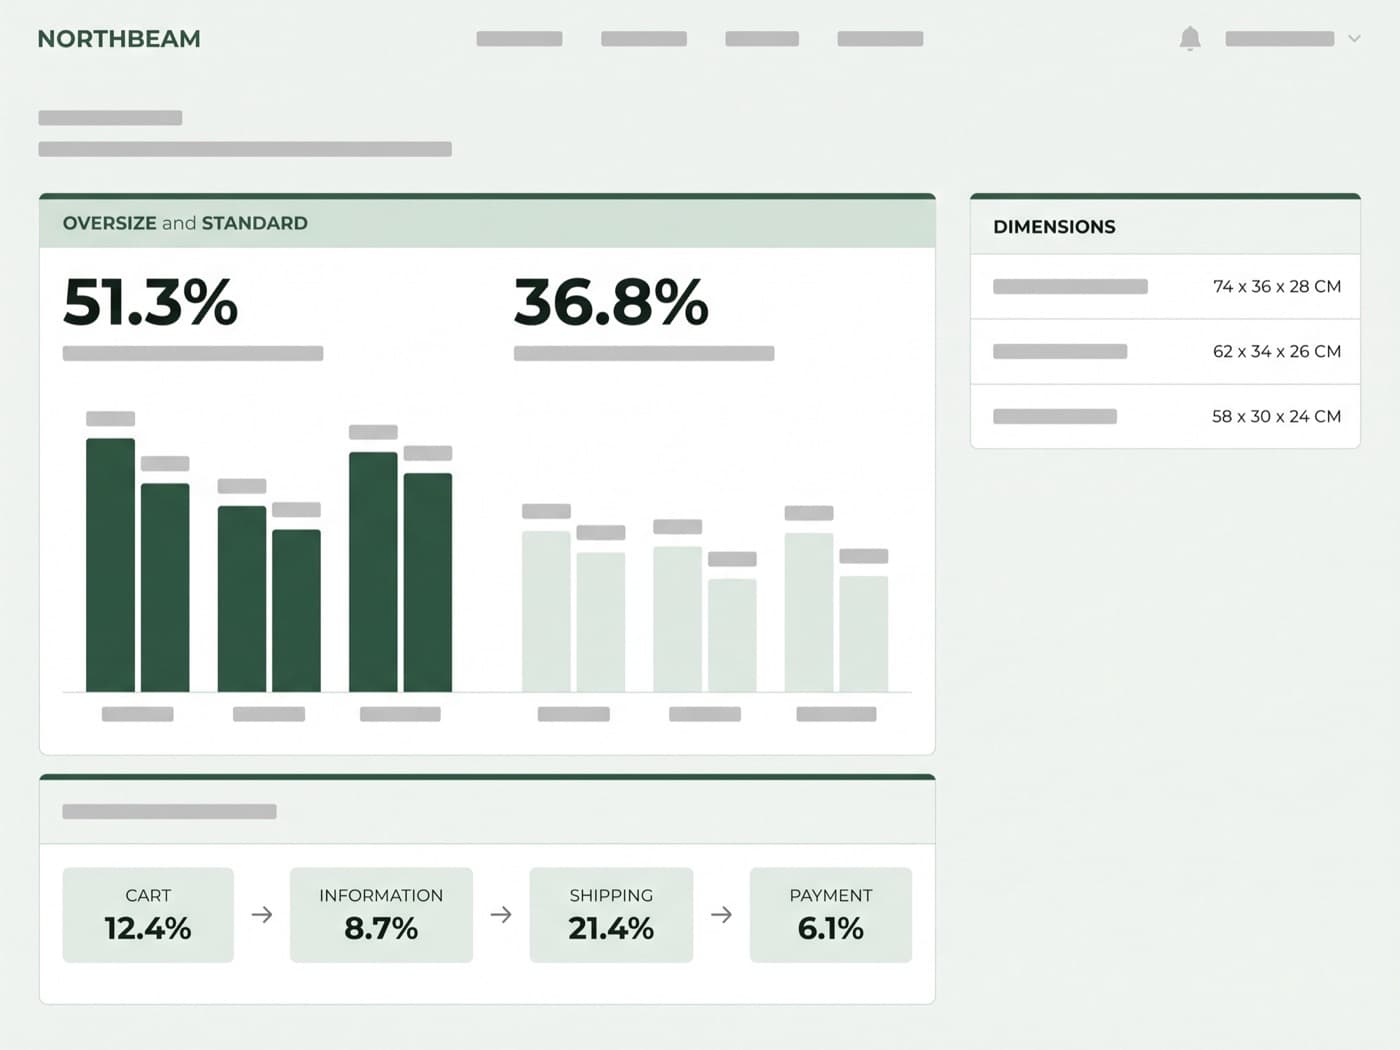
GA4 said the shipping step was the leak. It could not say why, because it does not know what is in the basket. We joined 14 months of order and abandoned-checkout records in BigQuery against the product dimensions table, and the picture sharpened immediately: baskets containing an oversize item abandoned at 51.3% against 36.8% for everything else. The gap was not spread evenly across price bands. It appeared the moment a delivery surcharge could apply and was invisible until the shipping step.
We also ordered twelve competitor items to our own address to time the real delivery windows, because the site was quoting a range the warehouse had not been able to hit since the previous spring.
- 14 months of checkout events joined to product dimensions in BigQuery
- Abandonment segmented by oversize flag, basket value and device
- Twelve competitor deliveries timed end to end against our own quoted window
- 02
Phone the people who left
Thirty abandoned-checkout customers agreed to a fifteen-minute call. Nobody said the shipping was too expensive. Nineteen of the thirty said some version of "I wanted to check something first": sizing on technical outerwear over a mid-layer, whether boots could go back after being worn indoors, whether a pack would arrive before a trip.
We ran 47 unmoderated usability sessions on top, half of them on the tasks those calls exposed. Watching someone try to establish a return policy from inside a checkout with no navigation is the single most persuasive research artefact we produced all year.
- 30 phone interviews with abandoned-checkout customers
- 47 unmoderated remote sessions across mobile and desktop
- Returns-reason free text from 2,400 returns coded into 9 themes
- 03
Test the objection, not the interface
Every hypothesis had to name the specific thing a shopper was leaving to find out, and the specific place we were going to tell them instead. That framing threw out most of the ideas already on the backlog: the express-pay button reshuffle, the progress-bar restyle, three separate proposals to reduce the number of form fields, which our own session data showed was never where people stalled.
It also meant we tested the shipping subsidy properly rather than assuming it. Showing an oversize delivery rate early beat hiding it, and beat discounting it. The board kept its budget.
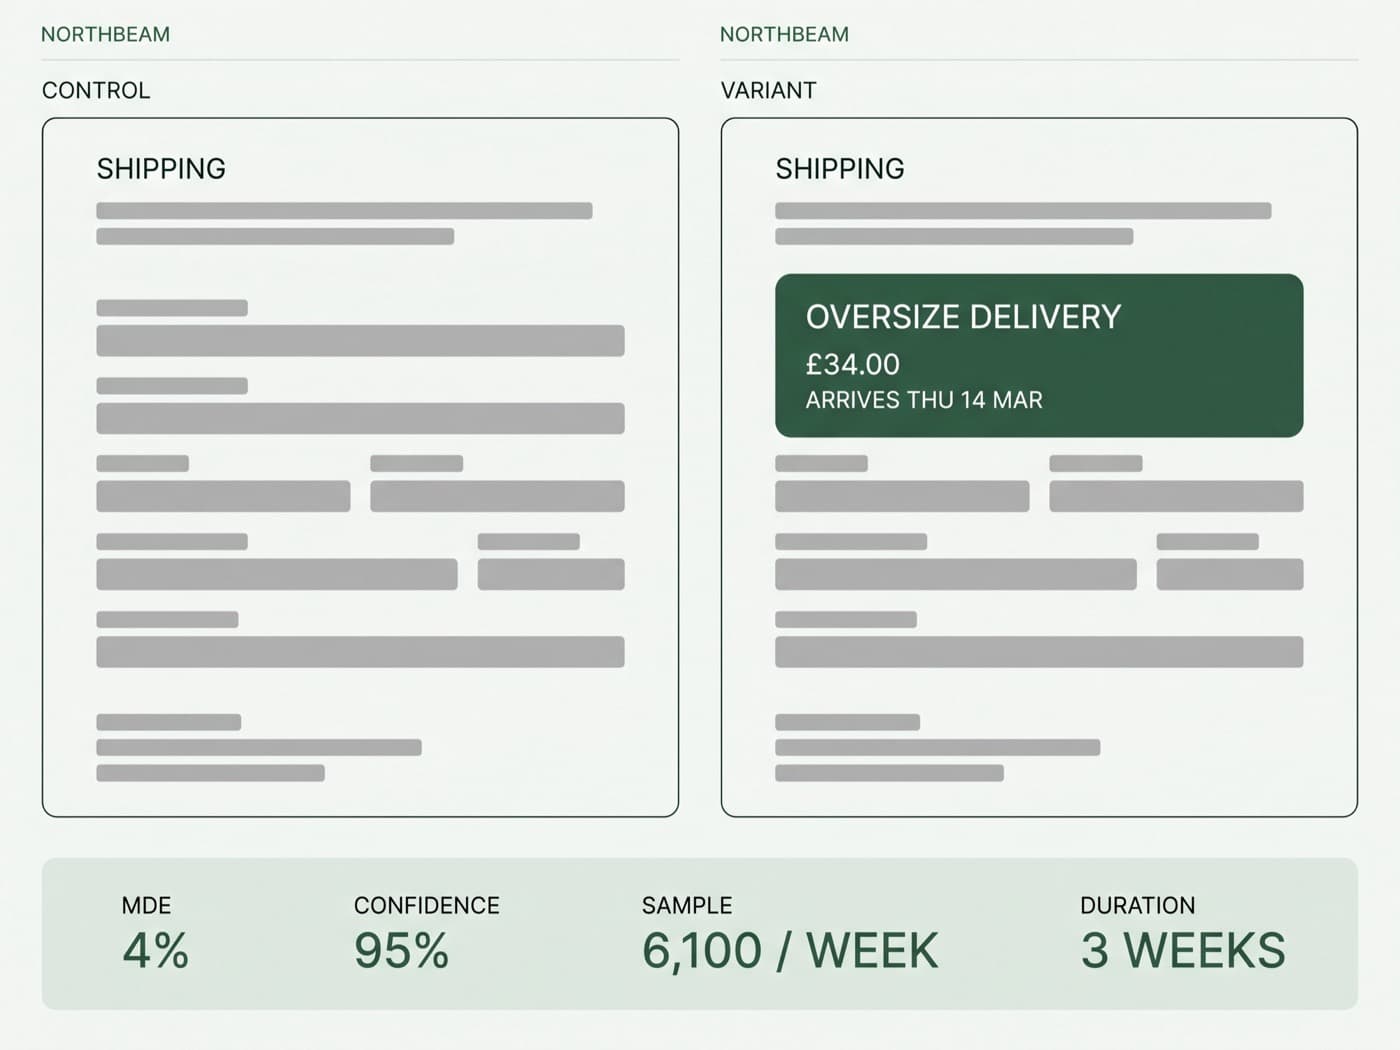
Sample sizes were fixed before build against a 4% minimum detectable effect, and checkout tests ran one at a time so we were never splitting an already thin funnel three ways.
- 58 hypotheses written, 42 shipped as experiments
- One concurrent test in checkout, two upstream, never more
- Minimum detectable effect of 4% relative, agreed before build
- 04
Work around the calendar, and admit the losses
Nothing shipped between 1 November and 6 January. We used the freeze to run read-only research on peak traffic and to write up the eight tests that lost, in the same detail as the winners. One of those write-ups, the trust-badge row that cost us 2.8%, has since stopped two other teams in the business from adding badges to their own flows.
Post-freeze, every winner was rebuilt as a native checkout UI extension inside a fortnight, so by month fourteen there was no experiment code carrying production traffic.
- Ten-week peak freeze respected, research-only
- Every winner rebuilt as a native extension within 14 days
- All 42 results, including 8 losses, in a shared decision log
The log
The experiment log
Forty-two tests over fourteen months. Six of the ones that changed the direction of the roadmap, with the relative change in checkout completion for the tested audience.
- 01
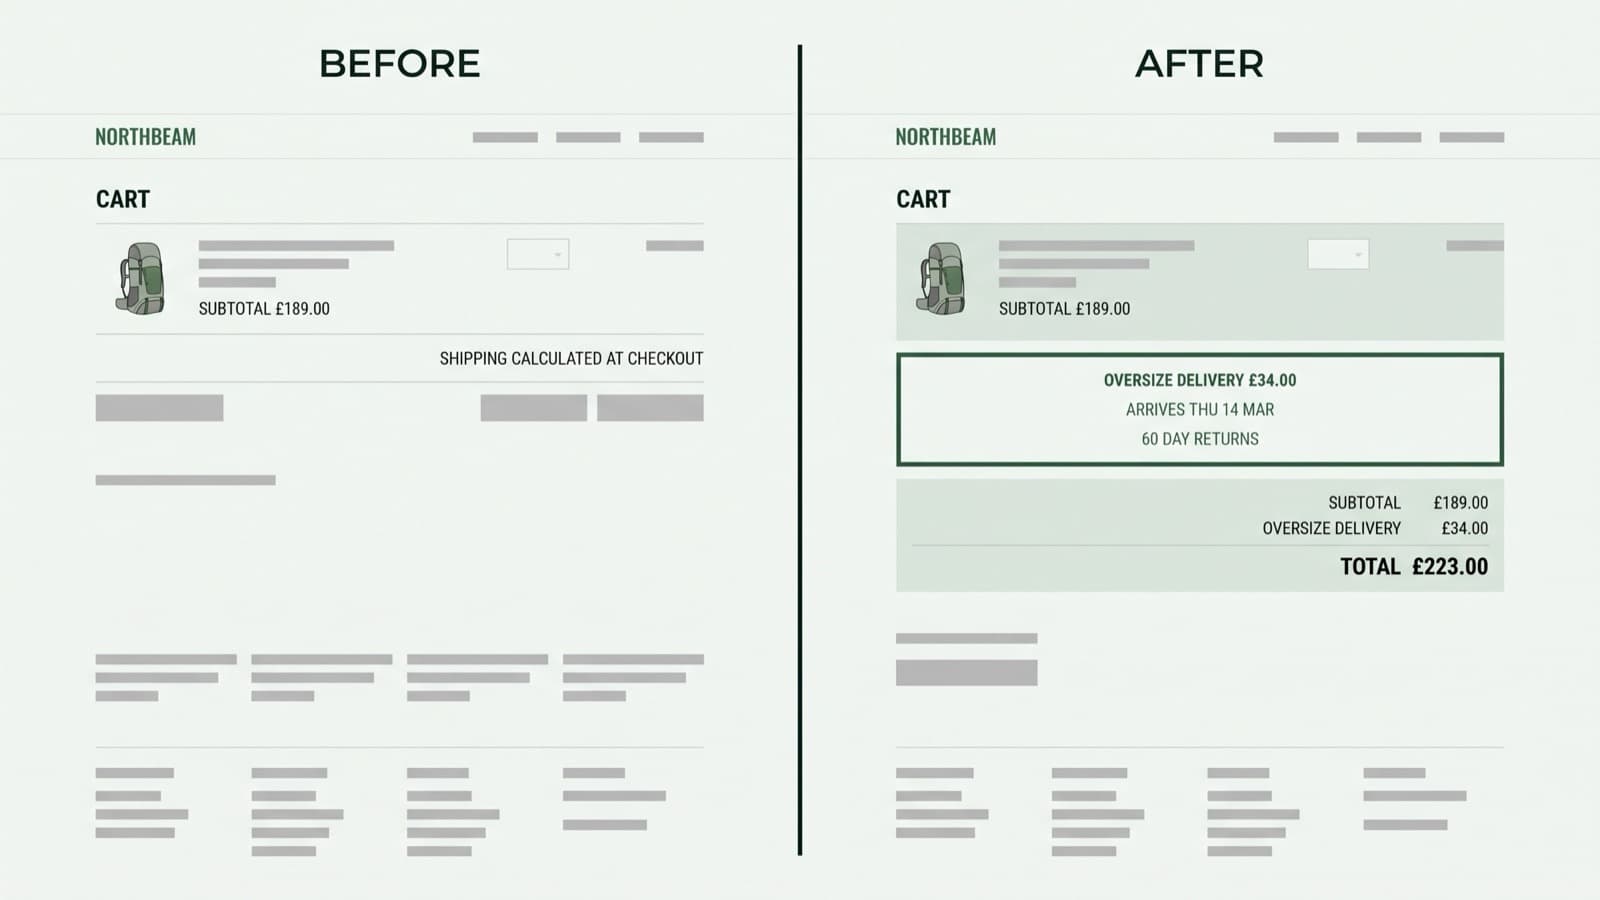
Oversize delivery rate on the cart page
Because baskets with an oversize item abandon at 51.3% against 36.8% for standard baskets, showing the actual oversize delivery rate on the cart page will raise checkout completion for those baskets.
- 02
Dated arrival window, not a shipping range
Because 19 of 30 interviewed abandoners left to check timing, replacing "3–5 working days" with a dated arrival window will raise checkout completion.
- 03
Returns terms inside the payment step
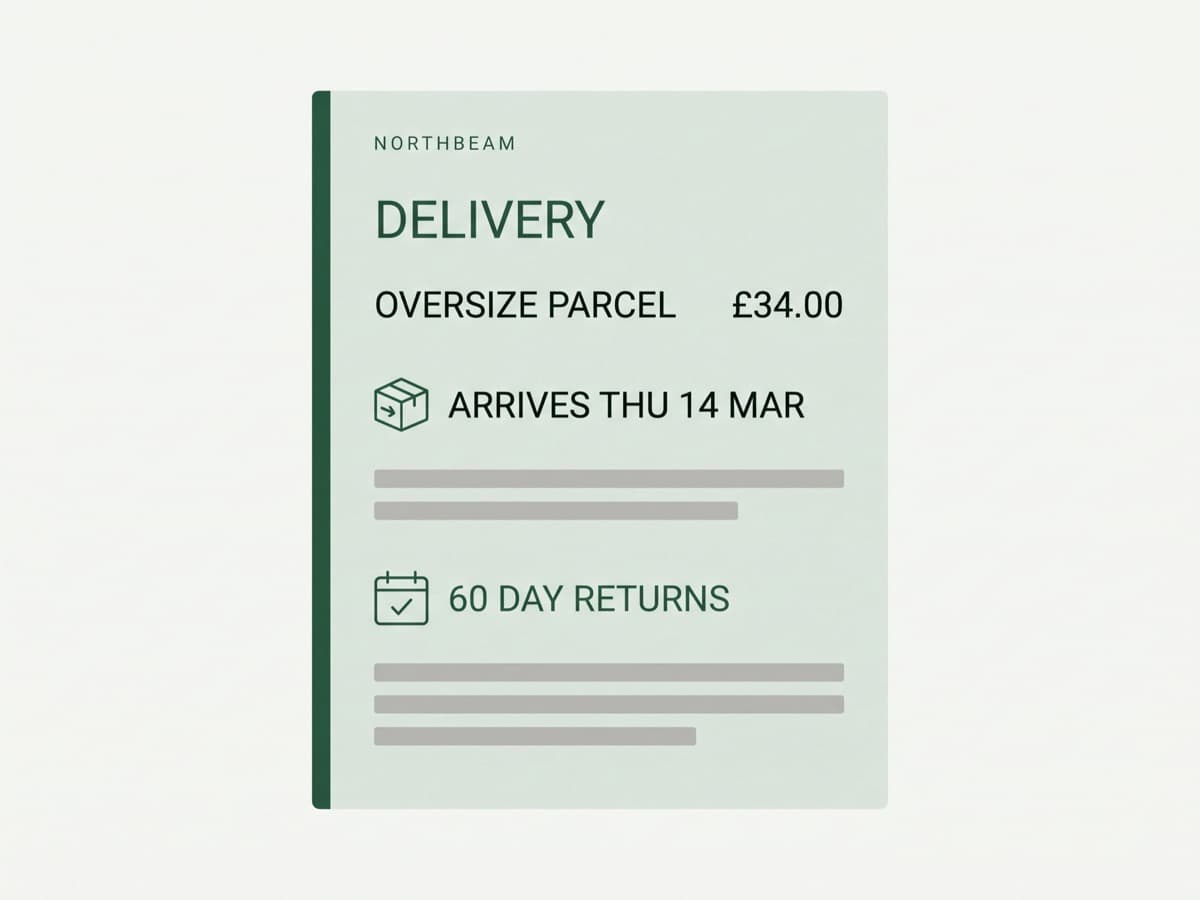
Because returns questions are the second-most-coded reason for leaving checkout, stating the returns window and worn-indoors policy in the payment step will raise completion on footwear baskets.
- 04
Guest checkout as the default path
Because 71% of checkout entries are first-time buyers, defaulting to guest checkout and offering the account at the confirmation screen will raise completion.
- 05
Security and payment badge row
Because payment-security doubt appears in exit feedback, a badge row above the card fields will raise completion at the payment step.
- 06
Free-shipping threshold progress bar
Because the £120 free-shipping threshold sits just above median basket value, a progress bar in the cart will raise both basket value and completion.
- Oversize delivery rate on the cart page+6.2%98%shipped
- Dated arrival window, not a shipping range+4.9%97%shipped
- Returns terms inside the payment step+3.1%96%shipped
- Guest checkout as the default path+2.2%95%shipped
- Security and payment badge row-2.8%93%not shipped
- Free-shipping threshold progress bar+0.3%flatnot shipped
| Experiment | Relative change | Confidence | Shipped |
|---|---|---|---|
| Oversize delivery rate on the cart page | +6.2% | 98% | Yes |
| Dated arrival window, not a shipping range | +4.9% | 97% | Yes |
| Returns terms inside the payment step | +3.1% | 96% | Yes |
| Guest checkout as the default path | +2.2% | 95% | Yes |
| Security and payment badge row | -2.8% | 93% | No |
| Free-shipping threshold progress bar | +0.3% | flat | No |
The results
What it moved
Checkout completion moved from 57.4% to 67.7%, an 18% relative gain, and it carried straight through to sitewide conversion, which went from 1.95% to 2.30% on unchanged traffic. At a £142 average order value that is roughly 630 extra orders a month, or £1.07m annualised.
The four checkout winners in the log compound to about +17.4% on their own; the remaining eleven small winners across the funnel account for the rest. That ordering matters. The single change everyone quotes internally is the delivery estimator, but the gain is really the accumulation of four separate answers to four separate questions people were leaving the page to resolve.
Mobile did most of the work. Mobile is 58% of sessions but only 42% of checkout entries, and it started from a far worse 48.2% completion; it finished at 61.1% against desktop’s 72.6%. The gap is still there and it is still the biggest number on the roadmap. The shipping subsidy the board had budgeted was never spent, which is the outcome we are proudest of and the one that appears in none of the charts.
- Checkout completion+18%57.4%67.7%
- Mobile checkout completion+27%48.2%61.1%
- Shipping-step exit rate-40%lower is better21.4%12.9%
- Median time in checkout-31%lower is better214s148s
| Metric | Before | After |
|---|---|---|
| Checkout completion | 57.4% | 67.7% |
| Mobile checkout completion | 48.2% | 61.1% |
| Shipping-step exit rate | 21.4% | 12.9% |
| Median time in checkout | 214s | 148s |
| Period | Checkout completion |
|---|---|
| M1 | 57.4% |
| M2 | 57.6% |
| M3 | 58.3% |
| M4 | 59.1% |
| M5 | 60.4% |
| M6 | 61.2% |
| M7 | 60.7% |
| M8 | 62.4% |
| M9 | 63.6% |
| M10 | 65% |
| M11 | 66.4% |
| M12 | 67.7% |
“42 tests in a year. Even the losers paid for themselves in decisions we didn’t make.”