Every CRO engagement we run starts in the same place: a GA4 funnel exploration that the client’s team could have built themselves in twenty minutes, if anyone had shown them how. It is the single chart that turns a vague sense that conversion is low into a specific, fixable step, and most stores have never built it. Here is the exact walkthrough, from session to purchase.
A GA4 ecommerce funnel tracks the five events that matter: view_item, add_to_cart, begin_checkout, add_payment_info and purchase. A funnel exploration shows how many users complete each step, where they stop, and how the drop-off differs by device, source and audience. Everything else in the interface is commentary.
The funnel that matters
GA4 ships with dozens of reports and most of them will not change a single decision. The one that will is the step-to-step funnel, because every conversion problem is local: shoppers do not abandon a store in general, they abandon a specific transition, and each transition has its own causes and its own fixes. Product views that never become carts point at price, imagery or missing information. Carts that never reach checkout point at surprise costs. Checkouts that never complete point at friction in the form itself. Which is why we build this exploration before touching anything, and why fixes chosen without it are guesswork with a nicer vocabulary.
Two settings trip people up before the chart even renders. GA4 funnels count users by default, not sessions, so the numbers will not match session-scoped reports and do not need to. And the standard reports section will happily show you the same events as tidy tables; the exploration earns its place because it sequences them, which is the difference between knowing 460 carts were created and knowing which step ate the other 3,740 product viewers.
Build the exploration step by step
The walkthrough below takes about twenty minutes in a standard GA4 property with ecommerce events in place.
- Open Explore, start a blank exploration, and choose the funnel technique rather than the default free-form table.
- Add five steps in order: view_item, add_to_cart, begin_checkout, add_payment_info, purchase. Name them in plain English so the chart reads at a glance.
- Make the funnel open rather than closed, so shoppers who enter at a later step, from an email that deep-links to checkout for instance, still appear.
- Add device category as a breakdown dimension. This single setting does more diagnostic work than everything else combined.
- Set the date range to at least a full month, so weekday and weekend behaviour are both represented, and save the exploration so it is one click next time.
Turn on elapsed time if you want to see how long shoppers sit between steps: long gaps between add_to_cart and begin_checkout usually mean comparison shopping rather than friction.
Verify your events before believing the chart
A funnel built on broken tracking is worse than no funnel, because it points fixes at the wrong step with total confidence. The bugs we find most often are add_to_cart firing on page load rather than on the click, duplicate purchase events inflating the final step, begin_checkout never firing on express-payment routes that skip the cart, and consent banners silently dropping a slice of every step. Spot-check each event in DebugView, then reconcile GA4 purchases against your platform’s order count for the same window. A gap of five to fifteen per cent is normal, because ad blockers and declined consent hide real buyers; treat GA4 as directionally right rather than penny-accurate, and check the gap stays stable month to month.
Reading the numbers
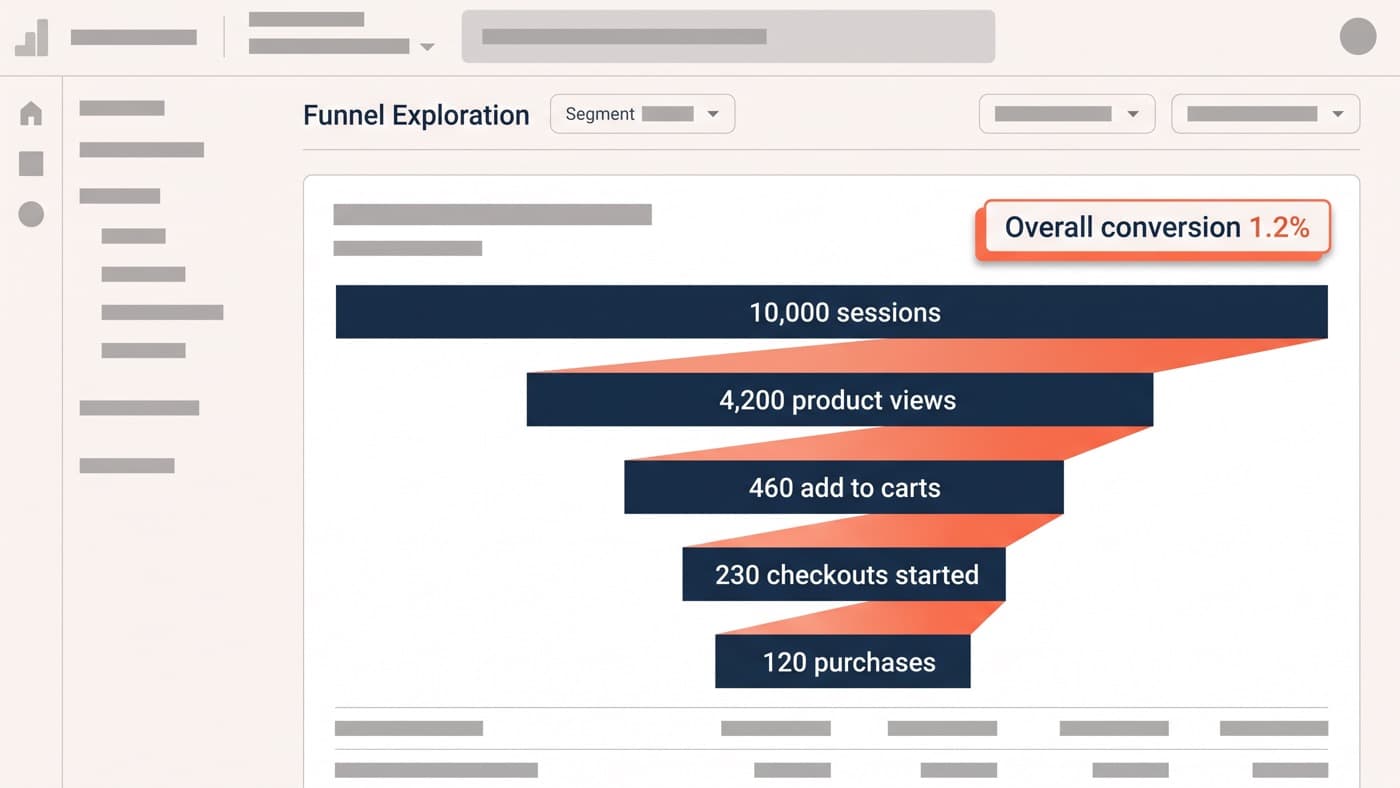
Here is a worked example from the shape we see constantly. A store gets 10,000 sessions in a month: 4,200 reach a product page, 460 add to cart, 230 begin checkout and 120 purchase. Overall conversion is 1.2%, which sounds like one problem but is actually three transitions performing very differently: 11% of product viewers add to cart, 50% of carts start checkout, and 52% of started checkouts complete. The add_payment_info step sits between checkout start and purchase, and mostly earns its place on stores with express wallets, where it separates shoppers who baulked at the form from shoppers who baulked at the final total.
Ranges help you decide which of those is the outlier. In the stores we audit, add-to-cart typically lands between 8 and 12% of product viewers, cart-to-checkout between 40 and 55%, and checkout completion between 45 and 60%, with catalogue, price point and traffic mix moving every one of them. So in the example, the product page and cart steps are within their usual bands and checkout completion sits at the low end: that is where the attention goes first. Your own trend beats any benchmark; the ranges only stop you from optimising a step that was never the problem.
Segment until the story appears
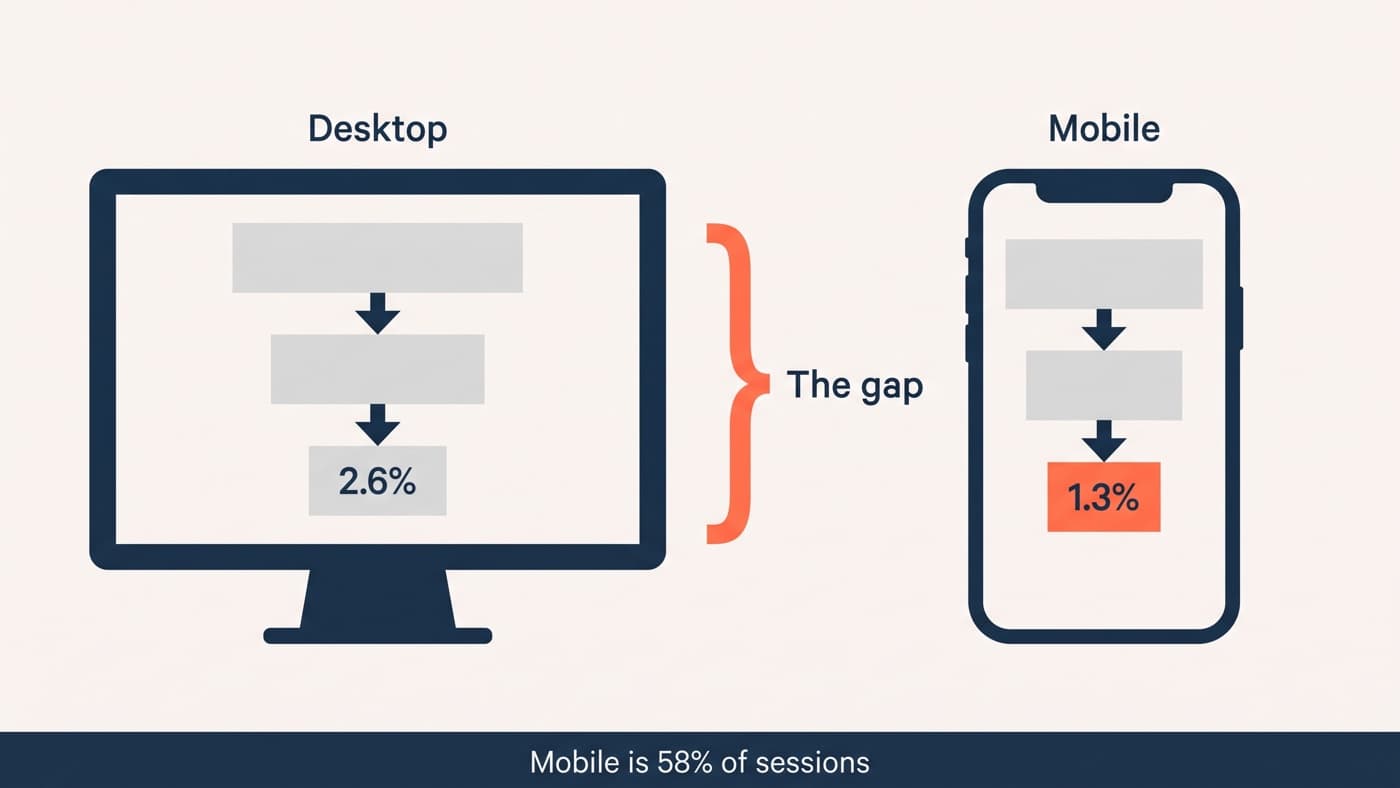
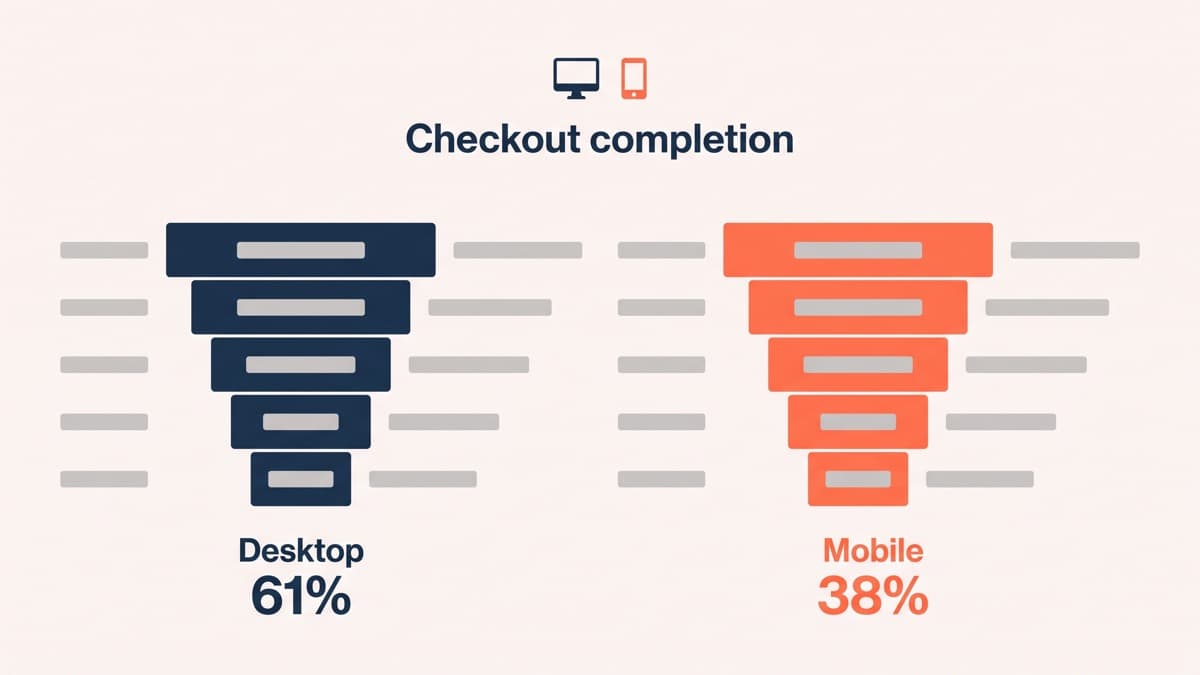
The blended funnel almost always hides the finding. Break the same funnel down by device and the example store splits into desktop checkout completion at 61% and mobile at 38%, which is no longer a checkout problem but a mobile checkout problem, a much smaller and more fixable thing. Run the same split by new versus returning users and by session source: paid traffic that adds to cart but never buys tells a different story from organic traffic that never adds at all. One dimension at a time, and stop when a segment is underperforming its siblings by a wide margin, because that is your leak. In the stores we audit, the mobile gap is the most common finding and the paid-traffic gap the second; both were invisible in the blended chart.
From leak to hypothesis
A drop in a funnel is a symptom, not a diagnosis. The funnel tells you where shoppers stop; it cannot tell you why, and guessing the why is how teams ship fixes that move nothing. Pair the step with qualitative evidence, watch recordings of mobile checkouts and read the maps for that template, the pairing our heatmaps and session recordings guide walks through, and write the hypothesis down in one form: because we observed X, we believe change Y will lift metric Z. For the example store that might read: because mobile checkout completion is 38% against desktop’s 61%, we believe collapsing the checkout form and adding express payment will lift mobile completion. The funnel then measures whether it did.
Then test the change rather than trusting it, because plausible hypotheses fail constantly; our post on why A/B tests fail is largely a catalogue of fixes that were obviously going to work and did not. Review the funnel monthly and after every release, and it becomes an early-warning system rather than an autopsy. If you would rather we built the exploration, verified the events and handed you the leak list, get in touch: it is the first week of every engagement we run.