Eleven months of testing, +31% revenue per visitor
A note on these case studies
Every brand in these case studies is an illustrative composite, not a client. We built them so a whole engagement could be shown end to end: the brief, the constraints, the tests that lost and the shape of what a programme like this moves. What is real is the method, the failure modes and the way the work runs. The figures illustrate that method rather than reporting one named client’s audited results.
- Revenue per visitor
- +31%
- from €2.14 to €2.80
- Product page → cart
- +22%
- from 8.1% to 9.9%
- Experiments shipped
- 19
- 11 winners, 5 flat, 3 losses
- Added revenue, 12 months
- €412k
- annualised from test lift
The brief
What they came to us with
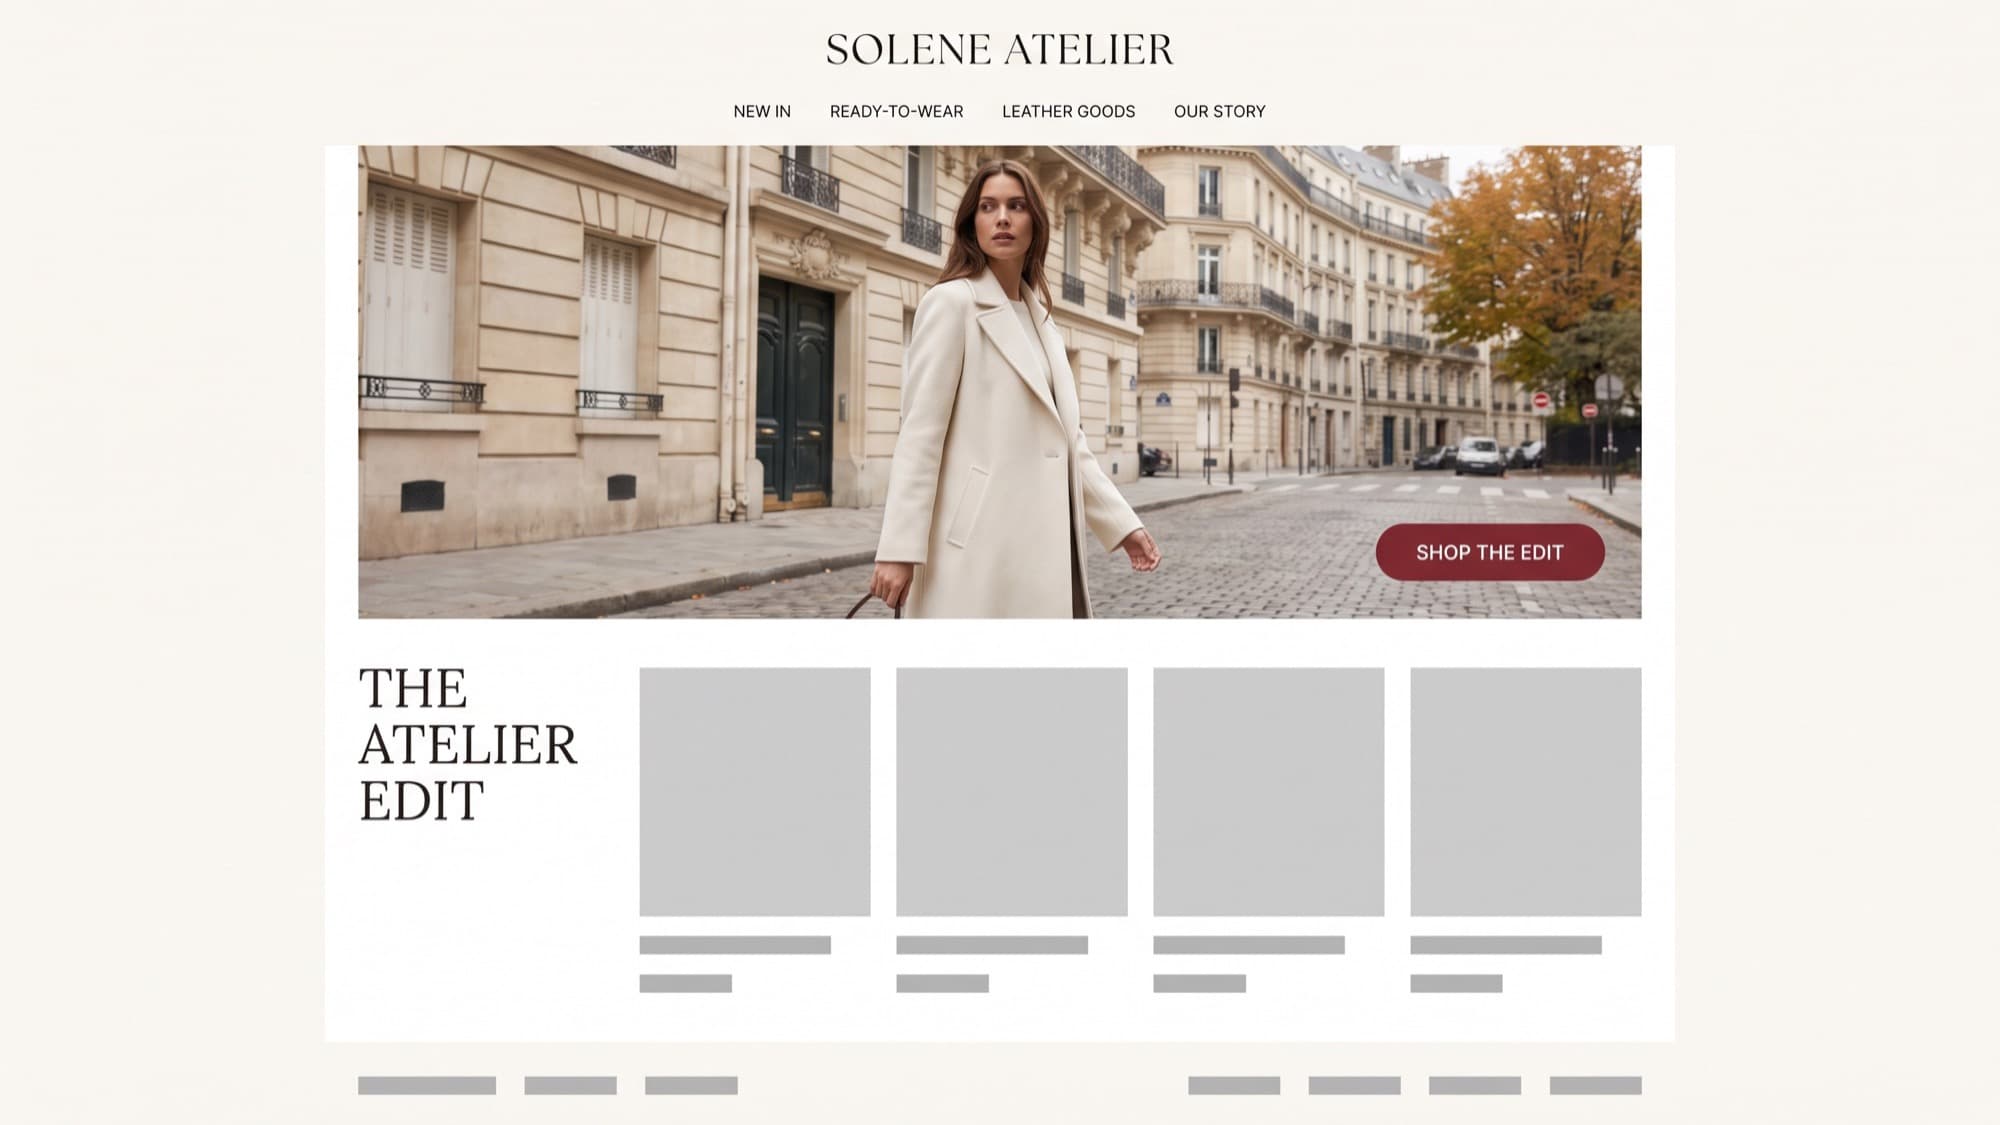
Solene Atelier sells small-batch womenswear from a Paris atelier: considered pieces, four drops a year, an audience that reads before it buys. Between 2023 and 2025 the brand grew almost entirely by buying traffic. Paid social spend tripled. Sessions tripled with it. Revenue did not.
Sitewide conversion had been stuck at 1.4% for six quarters while blended acquisition cost climbed 38%. The team had run a handful of tests in-house, but each one shipped on a hunch, ran for a week, and was called on whichever direction the numbers happened to be pointing on the Friday.
We were brought in to answer one question the founders could not answer internally: is the traffic bad, or is the site bad? The honest answer turned out to be neither. The site was fine for people who already knew the brand and quietly hostile to everybody else.
Constraints
- No redesign. The brand had just finished a rebrand and the visual language was not up for negotiation.
- Roughly 240,000 sessions a month, enough to test but not enough to test everything. Sample size dictated the roadmap.
- Four drops a year, each of which resets browsing behaviour for a fortnight. Tests had to run around the calendar, not through it.
- A three-person internal team. Anything we built had to be maintainable without us.
The approach
How we worked the problem
We spent the first three weeks not testing anything. The roadmap that came out of it was ordered by expected value, not by how interesting the idea was.
- 01
Find where the money leaks, not where the design annoys you
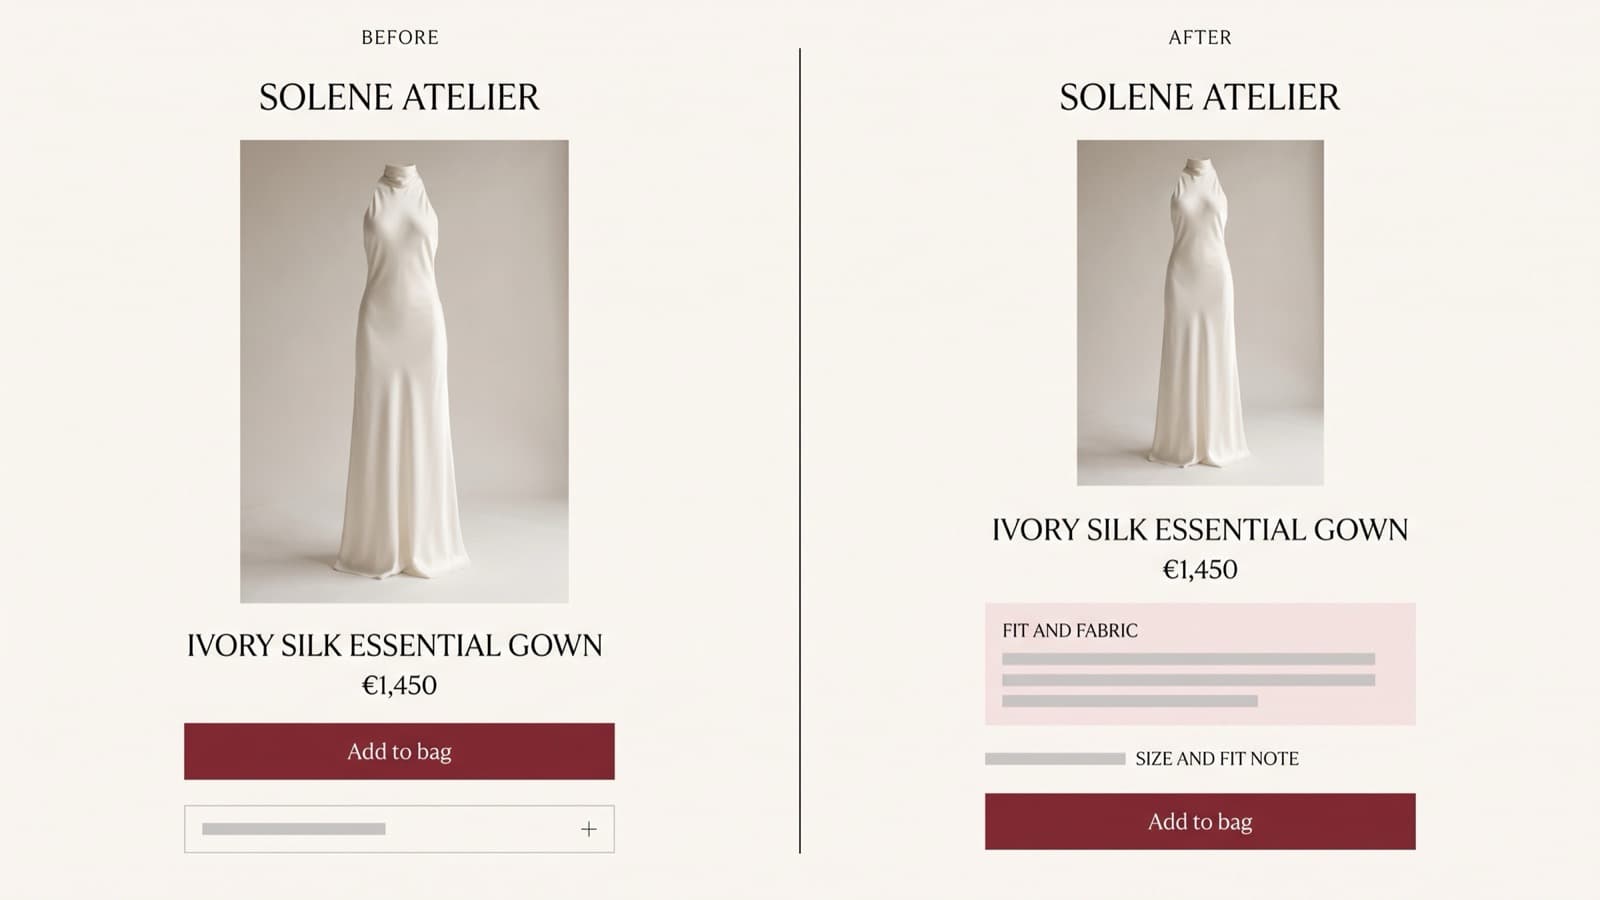
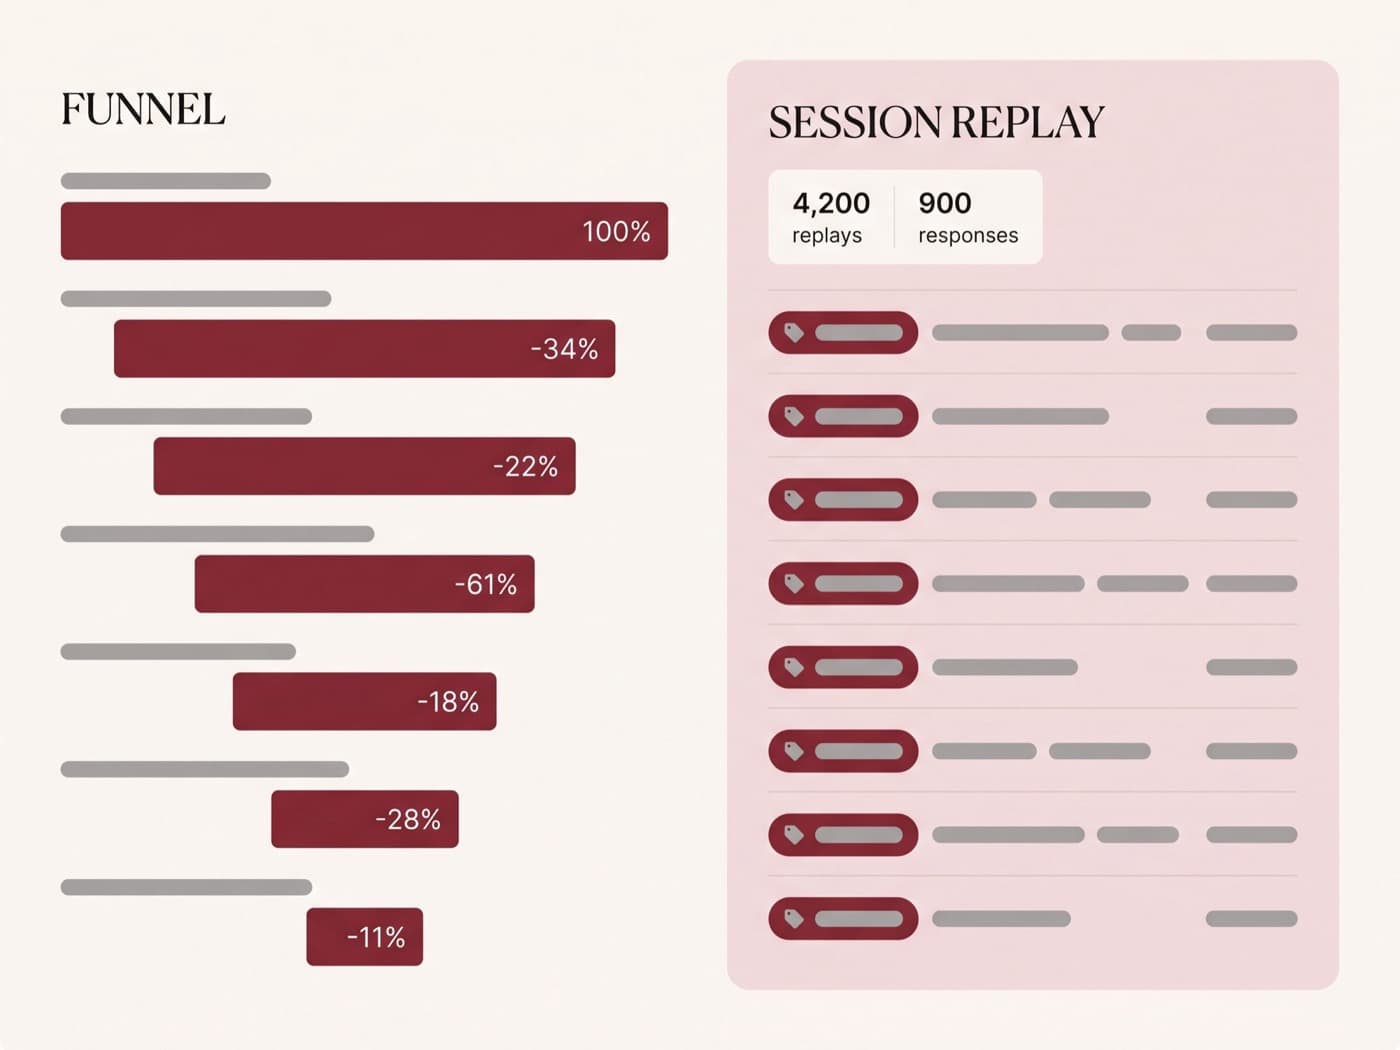
Session replay on 4,200 recordings, a funnel rebuilt in GA4, and 900 exit-intent survey responses. Three patterns accounted for most of the loss: shoppers could not tell what a garment was made of without opening a collapsed accordion, the size guide opened a modal that killed the page on mobile, and 61% of first-time visitors never saw a second product.
None of that is a taste problem. All of it is answerable with a test.
- 4,200 session replays reviewed and tagged
- Exit survey on cart and PDP, 900 responses
- Funnel rebuilt with drop-off at each of 7 steps
- 02
Write hypotheses that can be wrong
Every experiment entered the roadmap as a sentence with a number in it: because [evidence], we believe [change] will move [metric] by [amount] for [audience]. If a hypothesis could not be falsified, it did not get built.
That killed roughly a third of the ideas in the first workshop, including two the founders had been arguing about for a year.
- 31 hypotheses written, 19 shipped
- Each scored on evidence strength, reach and build cost
- Minimum detectable effect calculated before build, not after
- 03
Build flicker-free, ship on the real stack
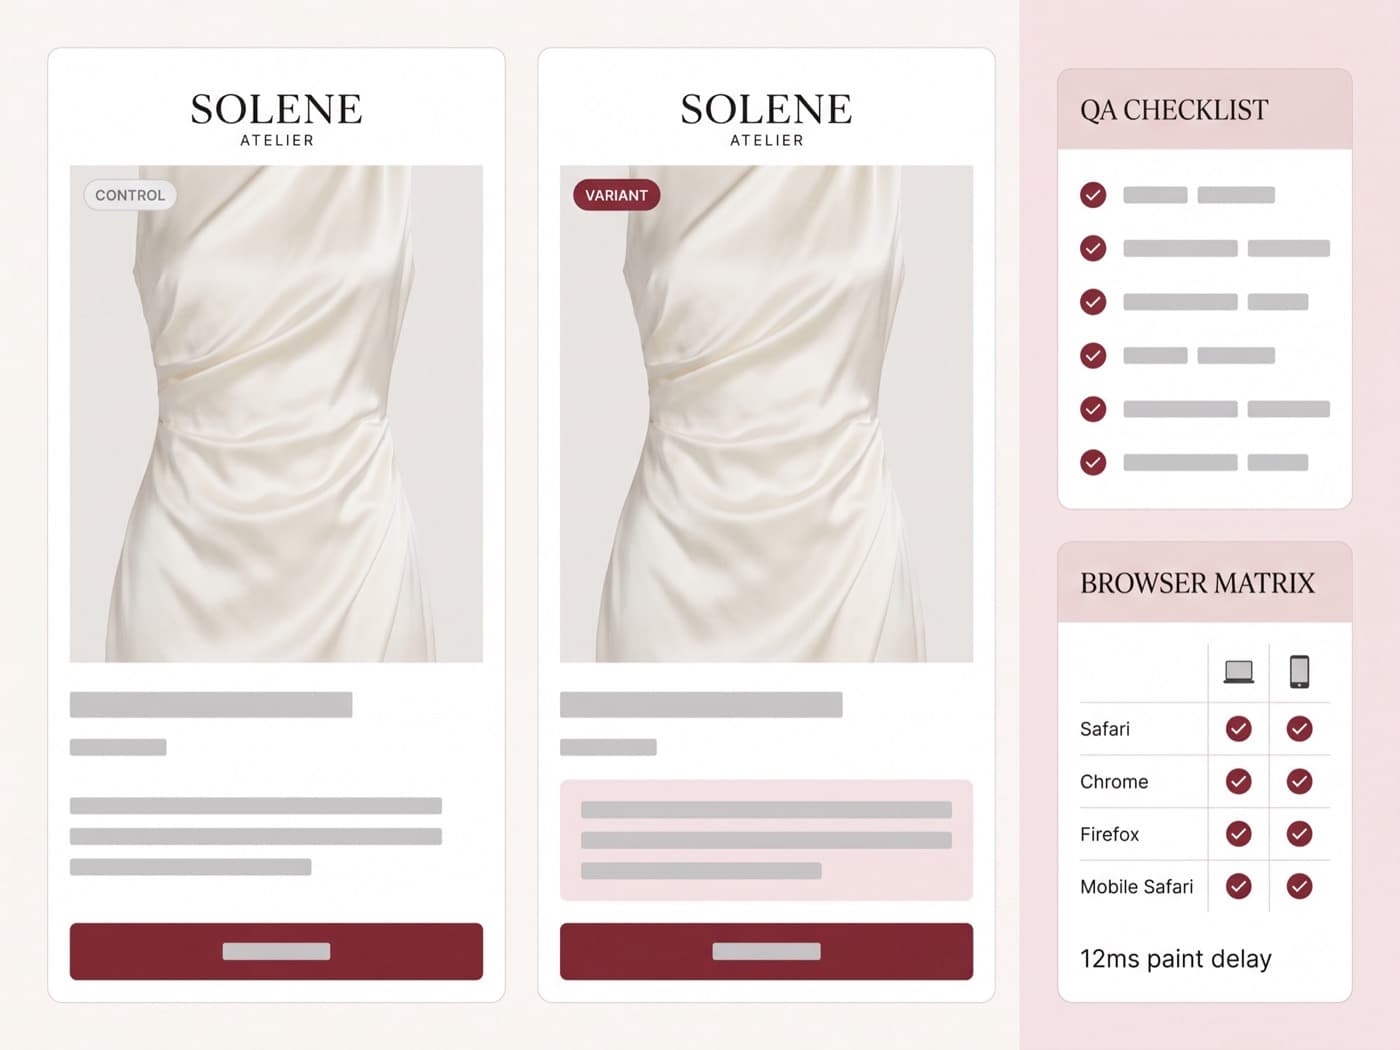
Client-side tests get a bad name because they flash the original before the variant paints. Every variant here was pre-rendered against the theme, loaded synchronously in the head, and QA-ed across four browsers and two screen widths before a single visitor saw it.
Winners were rebuilt natively in the Shopify theme within two weeks of the call, so the test stack never became load-bearing.
- Anti-flicker snippet, 12ms median paint delay
- Every winner rebuilt in-theme within 14 days
- QA matrix: Safari, Chrome, Firefox, mobile Safari
- 04
Call tests honestly, including the ones we lost
Fixed sample size, agreed before launch, two full business cycles minimum, no peeking at day three. Three tests lost. We wrote those up in the same detail as the winners, because a €0 result that stops a €40,000 redesign is worth money.
- Sequential testing with pre-registered stopping rules
- 95% confidence floor for a ship decision
- Every result written up in a shared decision log
The log
The experiment log
Nineteen tests over eleven months. Six of the ones that mattered most, with the relative change in revenue per visitor for the tested audience.
- 01
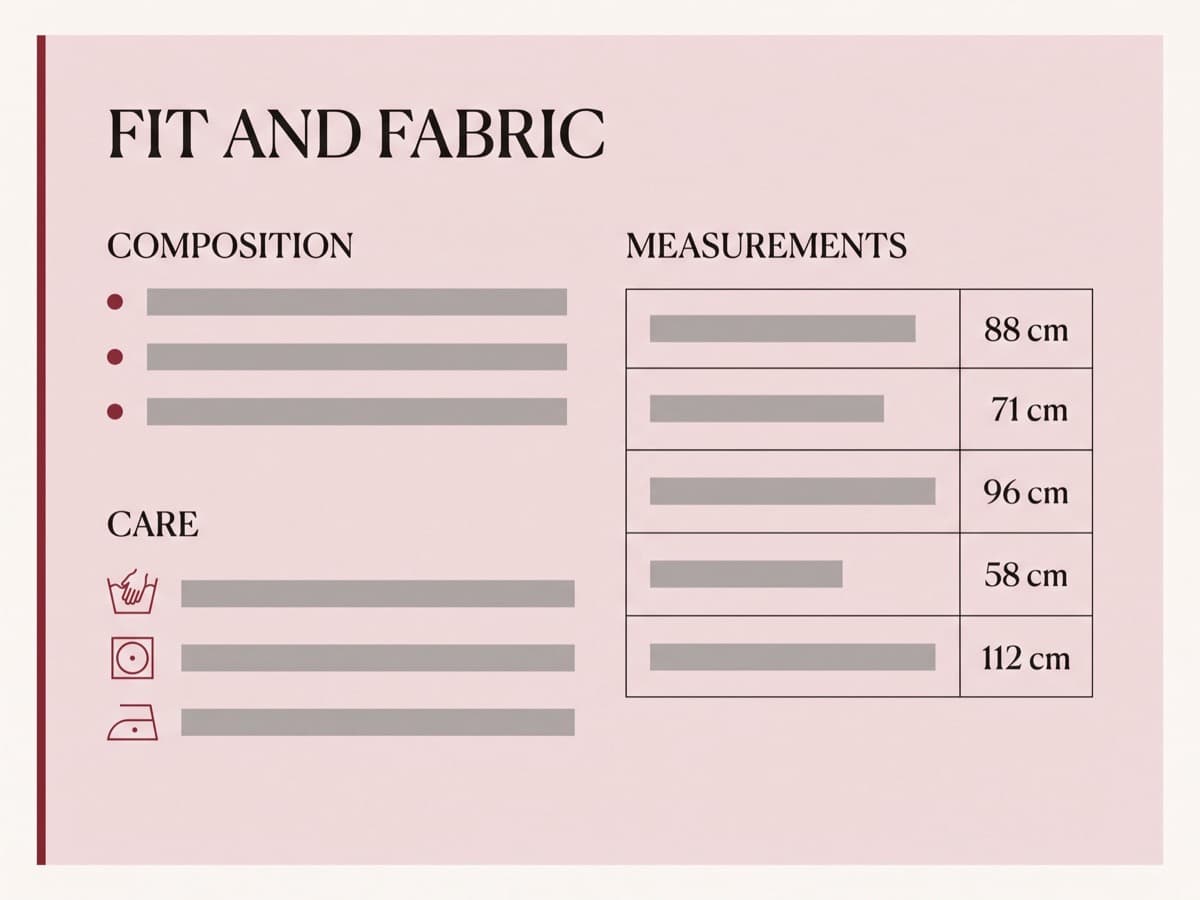
Fabric and fit panel above the fold
Because 61% of PDP exits never opened the details accordion, surfacing fabric, fit and care as an always-visible panel will raise add-to-cart for first-time visitors.
- 02
Inline size guide, no modal
Because the size modal has a 44% mobile bounce, replacing it with an inline expander will raise mobile add-to-cart.
- 03
Editorial "styled with" rail
Because most first-time visitors see only one product, an editorial cross-sell rail will raise products viewed per session and revenue per visitor.
- 04
Free-returns badge in the buy box
Because returns anxiety is the top exit-survey theme, a returns badge beside the price will raise add-to-cart.
- 05
Two-step express checkout
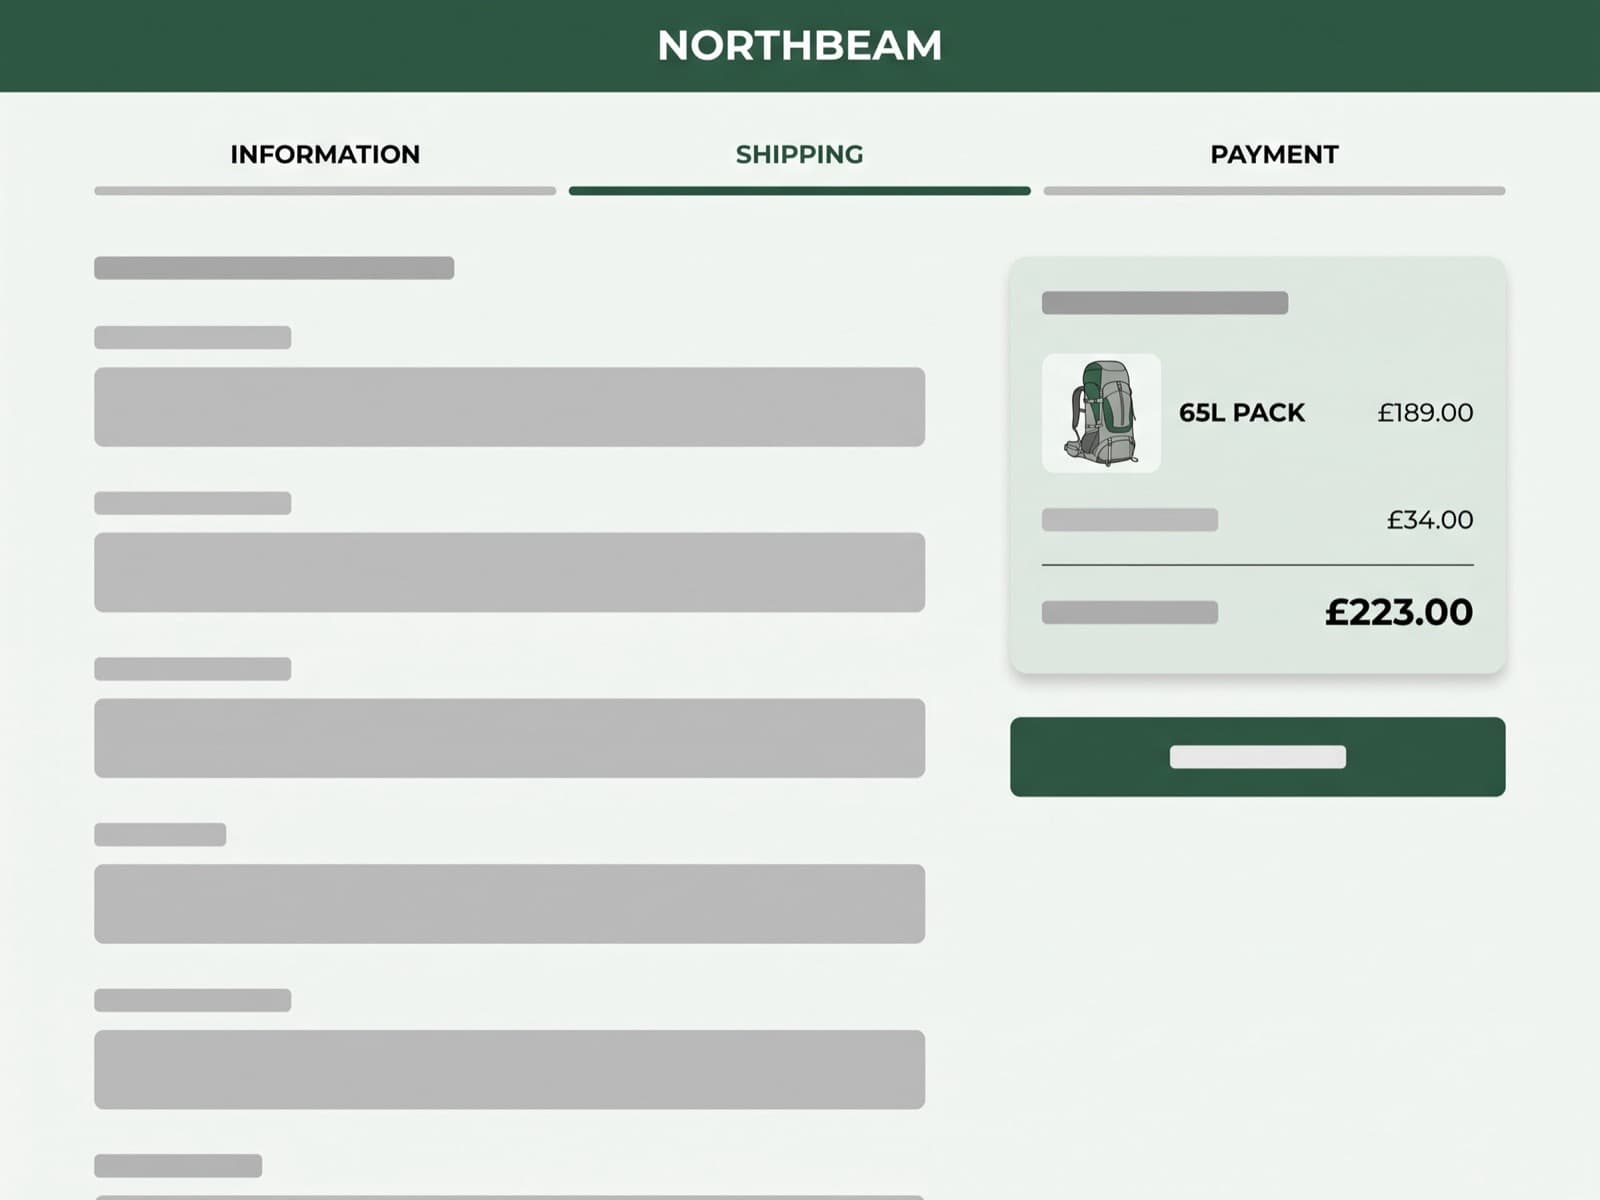
Because 28% of checkout starts abandon on the shipping step, collapsing checkout to two steps will raise completion.
- 06
Atelier provenance block on collection pages
Because brand-story pages have the highest assisted-conversion rate on site, a provenance block on collection pages will raise collection → PDP click-through.
- Fabric and fit panel above the fold+9.4%98%shipped
- Inline size guide, no modal+6.1%96%shipped
- Editorial "styled with" rail+7.8%97%shipped
- Free-returns badge in the buy box+0.4%flatnot shipped
- Two-step express checkout-3.2%94%not shipped
- Atelier provenance block on collection pages+4.6%95%shipped
| Experiment | Relative change | Confidence | Shipped |
|---|---|---|---|
| Fabric and fit panel above the fold | +9.4% | 98% | Yes |
| Inline size guide, no modal | +6.1% | 96% | Yes |
| Editorial "styled with" rail | +7.8% | 97% | Yes |
| Free-returns badge in the buy box | +0.4% | flat | No |
| Two-step express checkout | -3.2% | 94% | No |
| Atelier provenance block on collection pages | +4.6% | 95% | Yes |
The results
What it moved
Eleven months in, revenue per visitor is up 31% and sitewide conversion has moved from 1.4% to 1.79%, on the same media spend, with the same creative, against a rebrand nobody was allowed to touch.
The compounding effect matters more than any single test. Four of the eleven winners were small: one to two percent each, individually unremarkable. Stacked across a year of traffic they are worth more than the fabric panel, which is the change everyone remembers.
The programme now runs at three concurrent tests with the internal team writing their own hypotheses. Two of the last four winners were theirs.
- Revenue per visitor+31%€2.14€2.8
- Sitewide conversion+28%1.4%1.79%
- PDP → cart+22%8.1%9.9%
- Products per session+48%2.33.4
| Metric | Before | After |
|---|---|---|
| Revenue per visitor | €2.14 | €2.8 |
| Sitewide conversion | 1.4% | 1.79% |
| PDP → cart | 8.1% | 9.9% |
| Products per session | 2.3 | 3.4 |
| Period | Revenue per visitor |
|---|---|
| M1 | €2.14 |
| M2 | €2.18 |
| M3 | €2.31 |
| M4 | €2.35 |
| M5 | €2.44 |
| M6 | €2.49 |
| M7 | €2.58 |
| M8 | €2.61 |
| M9 | €2.7 |
| M10 | €2.74 |
| M11 | €2.8 |
“Nineteen experiments in eleven months and revenue per visitor is up 31%. The data made the board conversation easy.”