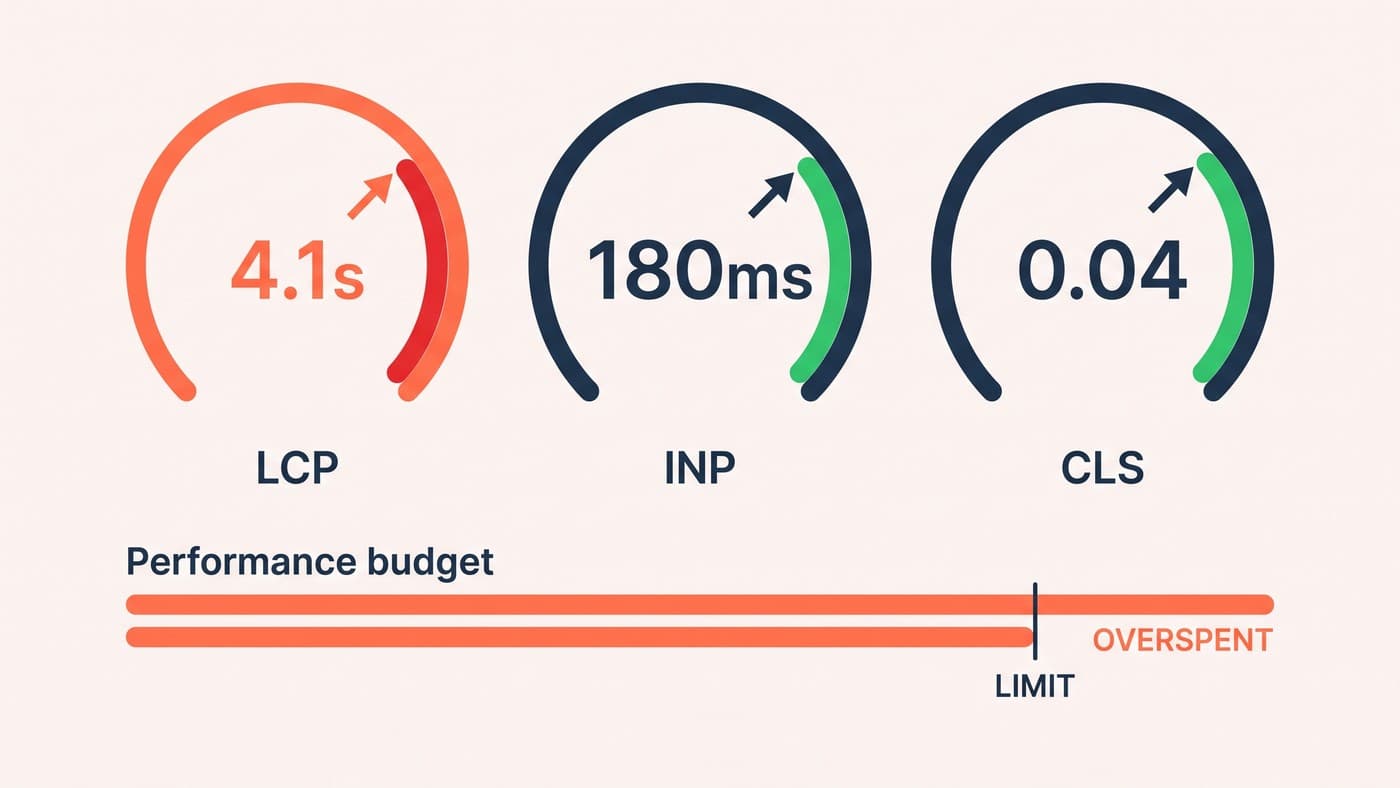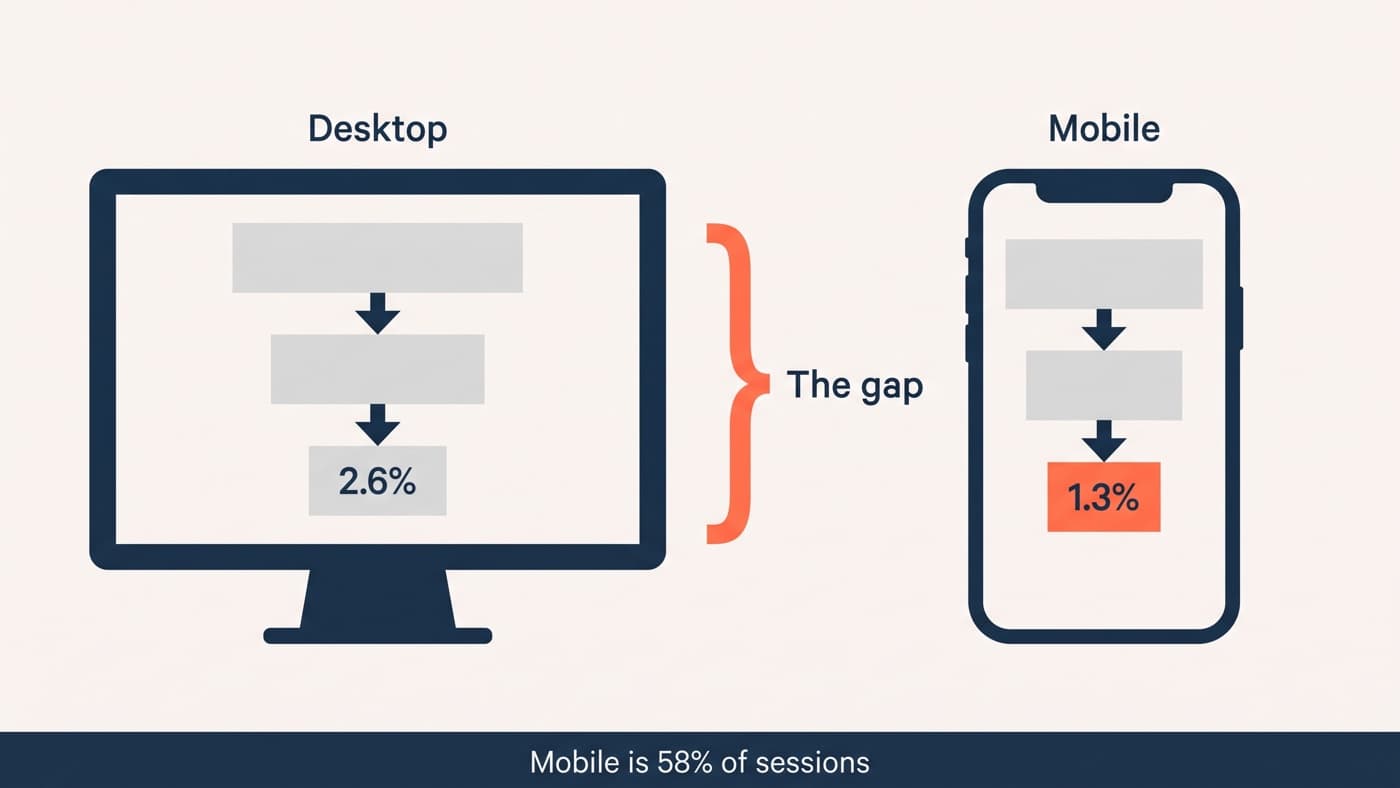
Mobile page speed on a storefront is judged by three published numbers: Largest Contentful Paint at 2.5 seconds or less, Interaction to Next Paint at 200 milliseconds or less, and Cumulative Layout Shift at 0.1 or less. They are assessed on real visits at the 75th percentile and segmented by device, which is why a mobile storefront cannot hide behind a desktop average or a lab score.
That last sentence is most of the article. Almost every argument about ecommerce performance is really an argument about which measurement counts, and a team that has not settled that will spend a quarter optimising a number nobody experiences.
What Core Web Vitals mean on a storefront
The three metrics map onto three ordinary storefront moments. Largest Contentful Paint is when the product photograph or the category heading actually appears, which is the moment the page stops looking broken. Interaction to Next Paint is what happens when somebody taps a filter, opens a variant picker or adds to basket, and it is the one that makes a site feel cheap when it is bad. Cumulative Layout Shift is the badge, the delivery message or the promotional bar arriving late and moving the buy button under a thumb that was already travelling.
What makes a storefront harder than a content site is that all three moments recur. A category page paints, then repaints as filters run. A product page paints, then shifts as a variant is chosen. So the metrics are measured against a page that keeps changing after it has finished loading.
The thresholds and the 75th percentile rule are published by Google at web.dev/articles/vitals, which states plainly that "a good threshold to measure is the 75th percentile of page loads, segmented across mobile and desktop devices". Read that as a promise rather than as a target: you are being graded on your slowest quarter of mobile visits, which is exactly the traffic a storefront acquires most expensively.
A lab score and field data are not the same claim
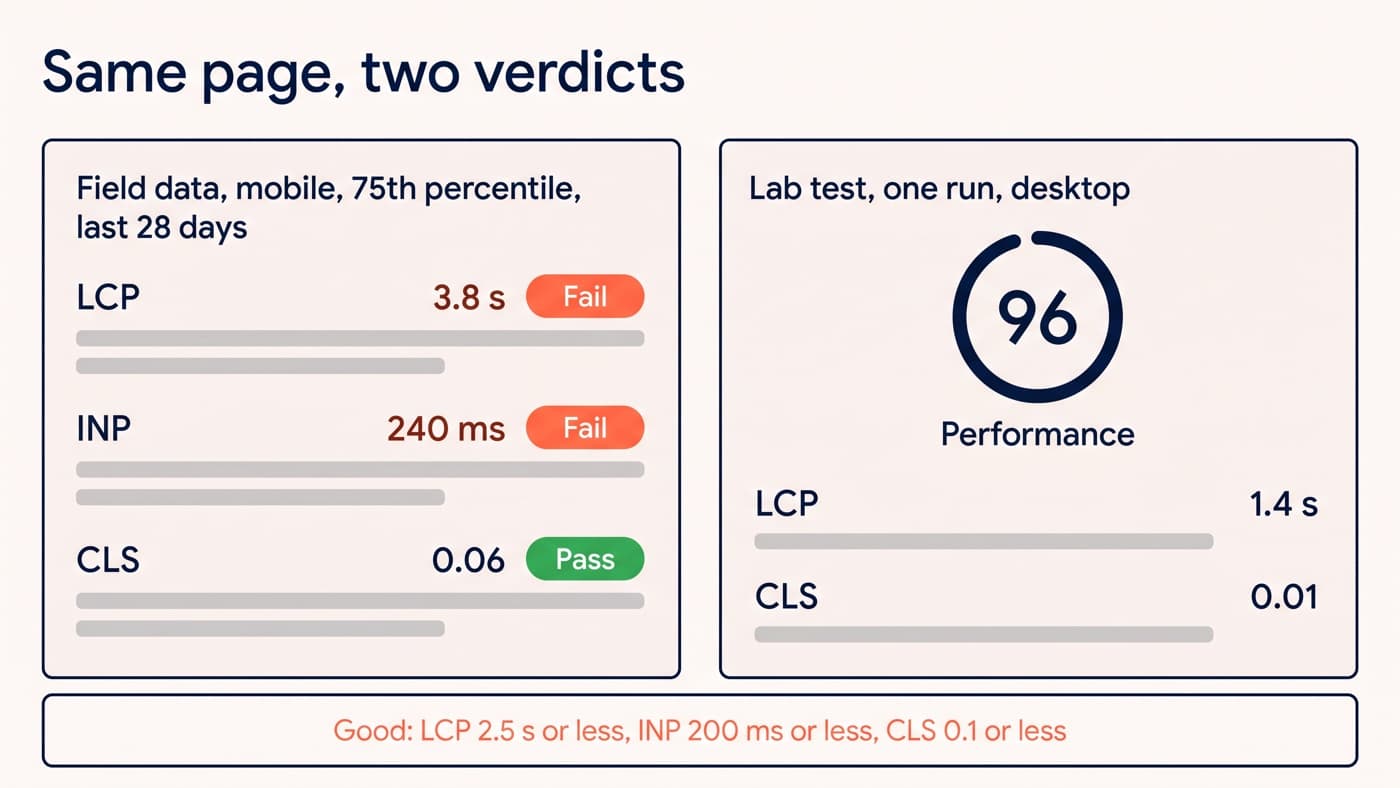
The most common performance meeting in ecommerce is one where a score of 96 sits on a slide while the field report says the page fails. Both are correct and they are answering different questions.
Google is direct about why. A lab test is "a single device, connected to a single network, run from a single geographic location", while field data "includes a wide variety of network and device conditions as well as a myriad of different types of user behavior". Two metrics suffer particularly: lab tools "cannot accurately predict when users will choose to interact with a page", so responsiveness is guesswork, and layout shift measured in a lab "only considers layout shifts that occur above the fold and during load", which is a fraction of what a real session produces. The conclusion offered is unambiguous, that where you have both, "field data is what you should use to prioritize your efforts", at web.dev/articles/lab-and-field-data-differences.
So the lab score keeps one job, which is telling you whether a change you made this afternoon helped, on a device held constant. It is a regression check, not a verdict. The verdict comes from the field, and if you do not have field data for your own templates yet, that is the first thing to fix rather than the score.
Which culprit owns which metric
Performance advice tends to arrive as an undifferentiated list, which is why it is so easy to spend a fortnight on the wrong thing. On a mobile storefront there are really three cost centres and they do not damage the same metric.
- Images own Largest Contentful Paint. The hero or the first product shot is almost always the largest element, and the fault is usually a file far bigger than the slot it lands in rather than insufficient compression.
- Third-party scripts own Interaction to Next Paint. They compete for the same main thread the interface needs, so the page paints on time and then refuses to respond for a quarter of a second when somebody taps.
- Late-loading interface furniture owns Cumulative Layout Shift. Badges, delivery promises, consent banners and promotional bars that arrive without reserved space, most damagingly around the buy button.
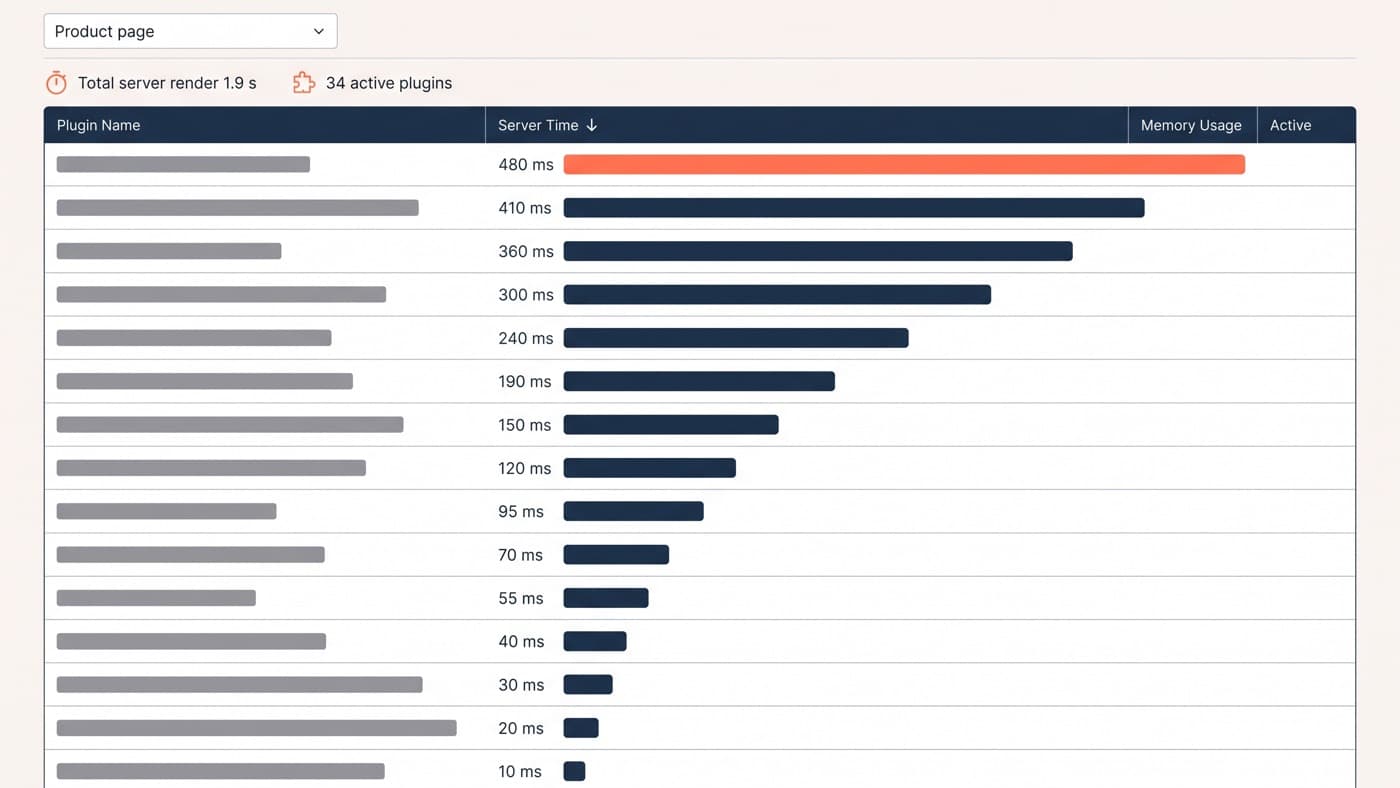
- App and plugin weight sits underneath all three, because every installed feature adds markup, styles and script to templates that never asked for it.
- Fonts and consent tooling are the two most commonly forgotten, and both block the first paint on the slowest connections rather than on yours.
Which of those you have is a question your field data answers in an afternoon, and the platform-specific mechanics live elsewhere: on Shopify the culprits are usually app weight and theme scripts, and on WooCommerce they are usually hosting, object caching and plugin count.
Third-party scripts and the owner column
Third-party code is the largest controllable cost on most storefronts, and the only inventory that ever produces action is one with an owner column in it. Script, blocking time, transfer size, the person who asked for it, and a decision. The decision column is the point: without it the audit becomes a document, and documents do not get faster.

The row that recurs on every store is the one whose owner is nobody. A personalisation tool, an abandoned experiment, a widget installed for a campaign that ended in the spring. Nobody defends it because nobody remembers it, and it is costing a third of a second of main-thread time on every product view. Removing it is the cheapest performance work in ecommerce and it needs no engineering at all.
It is worth knowing the shape of the worst case as well as the average one. Google notes that when a third party has server trouble, "rendering is blocked until the request times out, which can be anywhere from 10 to 80 seconds", at web.dev/articles/third-party-javascript. Nobody sees that in a median. It shows up as a support ticket saying the site was down, on a day the site was not down.
When a bad number is not a problem
Not every failing metric costs anything, and pretending otherwise is how performance work loses its budget. Three cases are worth naming before you spend.
The first is a failure on a template with no commercial job: a blog archive, a policy page, a legacy landing page nobody links to. The second is a metric that fails narrowly on one device family while the revenue-carrying segments pass, which is a compatibility bug rather than a performance programme. The third is a score, as opposed to a metric, since a composite number can move several points without any customer noticing anything at all.
The published data is worth reading in the same spirit. Speed and conversion move together across large samples, and the size of that relationship is measured differently by every publisher who reports it, which is why our benchmarks page reproduces each one with its source rather than quoting a single percentage. Anyone offering you one number for what a second is worth has stopped citing.
Deciding whether you have a real one
Four questions settle it, in order. Does the metric fail in field data rather than only in a lab run? Does it fail on a template that takes money? Does it fail for the segments that convert, or only for the ones that never would? And is there a specific, named cause, or only a low score?
Four yeses is a real problem and it deserves engineering time ahead of most of the roadmap, because it is suppressing every metric downstream of it rather than one. Anything less is a number, and a number can wait behind work that has a customer attached to it. That discipline is the same one that keeps a testing programme honest, and it is worth applying to performance precisely because performance is the easiest place in ecommerce to look busy. If your field data and your lab score have been disagreeing for a while, we will happily read both.